CIO Insights
Investing insights from Chief Investment Officer Mike Miller for Community Foundations, Endowments, and other not-for-profit fiduciaries, leaders, and stakeholders.
Demystifying Long-Term Investing
Investing isn’t a mysterious art; it's a rational process.
-
Define Your Goals: Clearly identify and quantify your financial objectives.
-
Allocate Wisely: Distribute your capital among asset classes aligned with your goals.
-
Diversify and Moderate: Shield yourself from negative outcomes through diversification, leveraging patience, risk understanding, and historical wisdom.
Sounds simple, but the devil's in the outcomes: over the past ten, 15, and 20 years, a staggering 87%, 92%, and 89% of endowments and foundations respectively failed to preserve their purchasing power, even amidst a double-digit S&P 500 surge1. The culprit? Human nature - the tendency to stray from long-term plans when the going gets tough.
Capital Markets: Navigating Choppy Waters
As of late 2023, the investment landscape is undergoing seismic shifts:
Geopolitical Complexities: The world is becoming increasingly intricate, with events like the recent Hamas attack on Israel exemplifying global surprises.
Inflationary Pressures: Structural inflation is on the rise, while the Federal Reserve grapples with balancing growth, stability, and inflation.
In this climate, traditional market indices show selective ignorance. The returns for the third quarter of 2023 indicate a stark contrast to the 'free money' era:
| ASSET CLASS | INDEX | 3Q 2023 RETURN | CYTD Return to 9/30/23 |
| US Large Cap | S&P 500 | -3.3% | +13.1% |
| US Small Cap | Russell 2000 | -5.1% | +2.5% |
| Non-US Developed | MSCI EAFE | -2.0% | +6.8% |
| Non-US Emerging | MSCI EM | -2.9% | +1.8% |
| Aggregate Bond | BB Agg | -3.2% | -1.2% |
To thrive, investors must look beyond conventional indices and embrace the broader market opportunity.
OUTCOMES: CYCLE, RINSE, REPEAT
The good news? Rational strategies work.
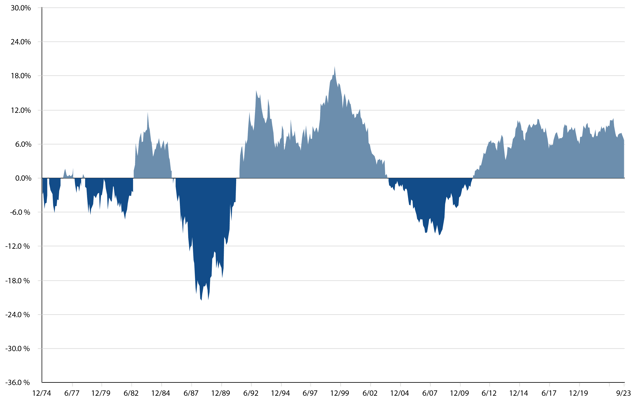
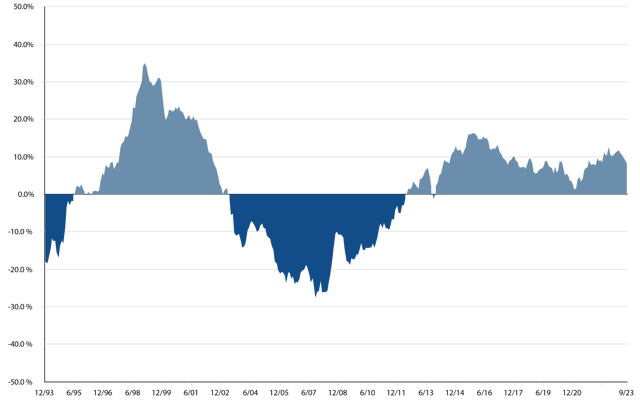
Below, two graphs vividly depict the cyclicality of returns, showcasing the S&P 500's dominance over non-US indices over the past 15 years. For believers in global diversification, the long-term story is currently not very good, as the S&P 500 has outperformed the two non-US indices by approximately 200 basis points per year since inception (to 9/30/23).
5 Year Rolling Periods From 1970 To September 30, 2023

S&P 500 Outperformed MSCI EAFE (NET) Outperformed
5 Year Rolling Periods From 1989 To September 30, 2023

S&P 500 Outperformed S&P/IFCI Composite Outperformed
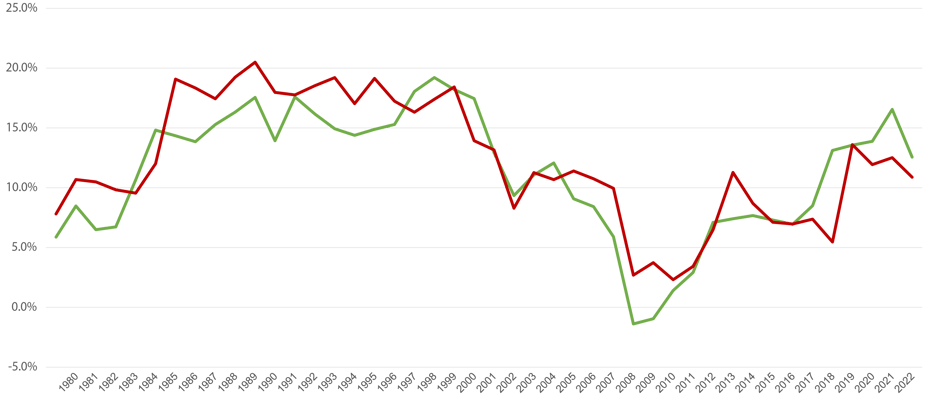
However, don’t close the case just yet, as introducing a disciplined contrarian strategy reveals a different narrative. A simple contrarian model consistently outperforms the S&P 500 over rolling ten-year periods.
-
The model starts in 1970 with a portfolio consisting of 60% S&P 500/40% EAFE.
-
At the beginning of 1989, it resets to a starting weight of 55% S&P 500/35% EAFE/10% S&P IFCI2.
-
At the end of each calendar year, capital is withdrawn from the strongest of the indices and given to the weakest.
-
If the pair is the S&P 500/EAFE, a 5% shift occurs; if the EM index is part of the pair, it’s 2.5%3.
-
We then took our portfolio’s returns and considered rolling ten-year periods.
Rolling 10-Year Return Comparison: S&P 500 vs Contrarian Global Strategy
1/1/1970 to 12/31/2022

S&P 500 Contrarian Global Equity Portfolio
The lesson?
Endowment investors must focus on preserving purchasing power, and a globally diversified, contrarian strategy achieves this more frequently than the S&P 500 alone.
THE EVIDENCE SPEAKS: LONG-TERM SUCCESS THROUGH RIGOR AND RESEARCH
The evidence is crystal clear: a disciplined, contrarian approach outshines conventional strategies. The S&P 500 succeeded 64% of the time in achieving at least a 9% annualized return, while the diversified/contrarian strategy achieved success 73% of the time.
| FREQUENCY OF 10-YEAR RETURNS >= 9% PER YEAR - 1970 TO 2022 |
|
| S&P 500 | 64% |
| Static Diversified Global Portfolio | 59% |
| Diversified/Contrarian Global Portfolio | 73% |
Would you embark on such a strategy today? For those committed to long-term success, the answer should be a resounding yes. The best outcomes arise from combining proven principles with a mix of index funds and differentiated active managers.
At Crewcial, our commitment is unwavering. Our investment team's extensive global travels and interactions with over 75 investment firms through 2023 reinforce our dedication to superior strategies, grounded in research and experience. In an industry too frequently oriented towards short-term comfort, we stand firm in delivering farsighted advice to drive outcomes that matter.
- Universe Data: InvMetrics E&F Universe – As of June 30, 2023
- The reset date is the start of the EM return series.
- In order to stay true to a strategy that would be realistic for most fiduciaries, we set minimum and maximum exposures for each index. The S&P 500 was 50% to 80%, EAFE was 17.5% to 45%, and EM was 5% to 15%.
Subscribe to CIO Insights
OFFICE
810 Seventh Avenue, 32nd Floor New York, NY 10019(212) 218-4900
Investment Expertise To Help You Make A Difference
Crewcial Partners LLC is a Securities and Exchange Commission registered investment advisor. Information presented is for educational purposes only and does not intend to make an offer or solicitation for the sale or purchase of any securities. Past performance is not indicative of future results, and investments involve risk and are not guaranteed. Be sure to first consult with a qualified financial adviser and/or tax professional before implementing any strategy discussed here.
