Top-10 Performers
nan%
41.2%
39.6%
36.7%
25.7%
5.7%
-6.6%
-20.8%
-27.9%
-28.2%
52.7%
43.0%
14.0%
8.9%
4.9%
0.0%
-7.6%
-12.5%
-14.8%
-19.3%
-1.3%
-7.9%
-8.9%
-11.8%
-22.0%
-22.2%
-24.3%
-26.9%
-35.5%
-37.7%
107.3%
85.0%
43.1%
30.7%
20.6%
20.5%
17.8%
15.0%
6.8%
5.7%
28.0%
25.2%
21.5%
20.7%
8.9%
7.2%
2.7%
0.5%
-0.5%
-21.9%
27.7%
12.3%
8.8%
6.5%
5.1%
5.0%
2.5%
-1.1%
-3.6%
-11.0%
58.5%
38.9%
25.1%
20.6%
19.4%
19.3%
15.3%
14.6%
12.3%
12.2%
133.5%
31.5%
24.3%
21.9%
20.8%
16.6%
3.6%
-1.0%
-8.1%
-18.9%
20.0%
-7.8%
-13.1%
-13.8%
-16.9%
-18.3%
-20.8%
-25.1%
-28.0%
-44.4%
146.9%
60.5%
58.6%
34.4%
11.3%
8.1%
4.8%
1.2%
-1.7%
-12.6%
53.1%
24.3%
22.9%
14.3%
11.6%
10.1%
9.4%
2.3%
-0.6%
-6.5%
28.9%
27.5%
25.1%
19.8%
18.3%
9.7%
9.2%
7.1%
1.8%
-4.3%
32.6%
21.2%
20.4%
17.5%
10.8%
5.9%
5.8%
5.2%
5.1%
4.7%
58.4%
44.3%
37.9%
36.7%
36.7%
34.6%
23.7%
20.1%
19.3%
8.1%
40.6%
27.5%
27.0%
24.1%
17.3%
15.4%
9.9%
-6.1%
-6.7%
-7.0%
117.8%
34.1%
27.5%
22.7%
8.4%
1.8%
1.2%
-3.0%
-12.5%
-12.8%
33.4%
28.6%
22.0%
19.7%
14.1%
13.4%
10.3%
8.8%
8.3%
4.9%
52.8%
51.7%
47.3%
39.0%
31.2%
31.2%
27.3%
24.1%
21.7%
-3.0%
28.4%
20.8%
2.8%
-0.8%
-0.8%
-5.1%
-5.4%
-6.6%
-15.1%
-25.7%
89.0%
57.6%
56.6%
47.3%
43.3%
28.2%
28.2%
23.0%
16.2%
11.0%
743.4%
82.3%
76.3%
42.5%
33.1%
30.9%
30.9%
10.9%
2.4%
-5.5%
125.5%
65.3%
65.3%
52.5%
49.8%
45.2%
34.6%
29.6%
23.1%
2.4%
88.6%
6.5%
5.2%
3.5%
-12.7%
-26.7%
-28.7%
-39.7%
-39.7%
-50.2%
239.3%
194.3%
104.0%
80.5%
57.9%
57.9%
57.4%
49.4%
31.5%
15.8%
171.2%
110.4%
66.0%
62.5%
44.4%
36.0%
36.0%
30.7%
25.5%
12.9%
84.8%
63.4%
52.0%
32.8%
28.5%
25.2%
12.4%
12.4%
9.2%
-6.1%
| Ticker | Name | Highest Rank | Streak | Best ROR | Index Weight | Market Cap | Sector |
|---|---|---|---|---|---|---|---|
| AAPL | Apple Inc. | 1 | 18 | 146.9% | 4.38% | 1,324,898,024,092 | Information Technology |
| AIG | American International Group | 4 | 6 | 36.7% | 1.77% | 184,604,368,746 | Financials |
| AMZN | Amazon.com, Inc. | 1 | 11 | 117.8% | 2.98% | 1,222,105,759,043 | Consumer Discretionary |
| AVGO | Broadcom Inc. | 1 | 2 | 110.4% | 2.37% | 1,234,063,039,480 | Information Technology |
| BAC | Bank Of America | 3 | 4 | 21.5% | 1.72% | 199,672,231,668 | Financials |
| BRK/B | Berkshire Hathaway Inc. Class B | 3 | 12 | 29.6% | 1.59% | 324,852,214,821 | Financials |
| C | Citigroup | 3 | 7 | 43.1% | 2.31% | 239,929,487,376 | Financials |
| CSCO | Cisco Systems | 1 | 4 | 85.0% | 1.70% | 193,276,642,325 | Information Technology |
| CVX | Chevron Corporation | 2 | 8 | 31.5% | 1.61% | 195,439,007,349 | Energy |
| FB | Meta Platforms, Inc. Class A | 2 | 7 | 56.6% | 1.68% | 463,934,828,340 | Communication Services |
| GE | General Electric Company | 2 | 13 | 37.9% | 2.35% | 283,865,428,330 | Industrials |
| GOOG | Alphabet Inc. Class C | 1 | 10 | 65.3% | 1.66% | 650,675,942,313 | Communication Services |
| GOOGL | Alphabet Inc. Class A | 2 | 9 | 65.3% | 1.80% | 666,929,184,139 | Communication Services |
| IBM | International Business Machines Corporation | 2 | 9 | 58.6% | 1.68% | 175,015,077,333 | Information Technology |
| INTC | Intel | 1 | 4 | 107.3% | 1.84% | 193,305,627,525 | Information Technology |
| JNJ | Johnson & Johnson | 2 | 20 | 34.6% | 1.63% | 255,418,309,875 | Health Care |
| JPM | JPMorgan Chase & Co. | 1 | 14 | 47.3% | 1.42% | 286,679,339,794 | Financials |
| META | Meta Platforms, Inc. Class A | 2 | 3 | 194.3% | 2.55% | 1,246,542,251,421 | Communication Services |
| MO | Altria Group Inc | 1 | 2 | 27.7% | 1.46% | 167,637,206,550 | Consumer Staples |
| MRK | MERCK & CO. INC. | 1 | 2 | 39.6% | 1.77% | 171,516,407,952 | Health Care |
| MSFT | Microsoft Corporation | 1 | 25 | 60.5% | 3.45% | 935,997,696,516 | Information Technology |
| NVDA | NVIDIA Corporation | 1 | 4 | 239.3% | 4.87% | 2,396,814,625,000 | Information Technology |
| ORCL | ORACLE CORPORATION | 6 | 1 | 5.7% | 1.48% | 162,675,832,500 | Information Technology |
| PFE | Pfizer Inc. | 1 | 11 | 41.2% | 1.89% | 199,322,091,864 | Health Care |
| PG | The Procter & Gamble Company | 4 | 10 | 23.7% | 1.70% | 195,087,163,825 | Consumer Staples |
| SBC | SBC COMMUNICATIONS INC | 1 | 1 | nan% | 1.47% | 161,632,365,250 | Communication Services |
| T | AT&T Inc. | 2 | 7 | 28.6% | 1.70% | 198,356,617,639 | Communication Services |
| TSLA | Tesla, Inc. | 1 | 5 | 743.4% | 1.88% | 962,605,406,442 | Consumer Discretionary |
| UNH | UnitedHealth Group Incorporated | 2 | 2 | 45.2% | 1.35% | 484,157,188,304 | Health Care |
| V | Visa Inc. Class A | 5 | 1 | 43.3% | 1.20% | 321,654,403,417 | Information Technology |
| WFC | Wells Fargo & Company | 4 | 3 | 36.7% | 1.38% | 267,065,085,653 | Financials |
| WMT | Wal Mart Stores | 1 | 6 | 20.0% | 2.22% | 232,019,347,456 | Consumer Staples |
| XOM | Exxon Mobil Corporation | 1 | 19 | 88.6% | 2.86% | 366,533,600,940 | Energy |


FROM OUR DATA DESK
Welcome to the new format of the Community Foundation Survey.
Over the past year, many of you have asked for a cleaner, more flexible way to explore and share this report. We’ve redesigned it to do just that. Now you can view trends by peer group, compare performance and allocation across time horizons, and download only the visuals you need. No PDF skimming required.
It’s the same data you’ve come to rely on, just easier to work with.
We’ve also made space for fresh insights and quick takes throughout, helping you spot shifts faster, find your footing, and bring stakeholders along more clearly. The features we’ve prioritized reflect what we’ve consistently heard from you and your peers: make it simpler to benchmark, easier to pull what matters, and faster to turn data into action.
This is just the start. Thank you for your engagement and input, which will continue to shape what comes next.
Jay Burke
Crewcial's Director of Information Management
Longtime steward of the Community Foundation Survey
FEATURED POLL RESULTS
Each quarter, we spotlight a timely pulse-check from your peers—offering a window into how fellow community foundations are planning, adapting, and executing in real time.
Q2 POLL : WHICH STRATEGIC SHIFT IS YOUR FOUNDATION MOST FOCUSED ON OVER THE NEXT 3 TO 5 YEARS?
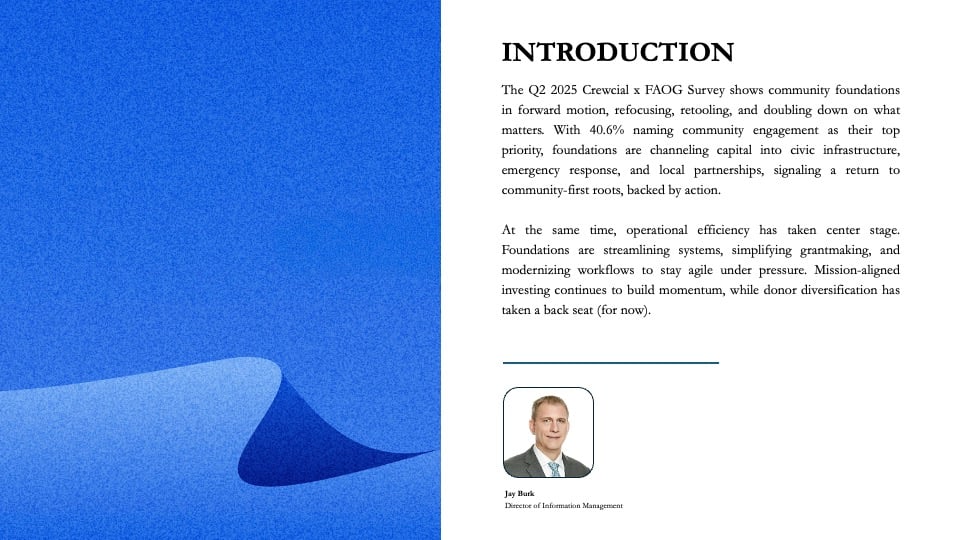
Community foundations are sharpening their strategic focus, placing greater emphasis on proximity-driven impact and local relevance. Rather than viewing community engagement as a broadly, perhaps too nebulously, defined imperative, many are delineating and operationalizing it through targeted investments in local civic infrastructure and partnerships, suggesting a maturation of, and literal homing in on, mission execution.
In parallel, the focus on operational efficiency reflects more than internal cleanup; it can be read as a bid to future-proof institutions under constrained capacity: streamlining grants management, integrating systems, and reallocating human capital to frontline functions.
Mission alignment in portfolios remains a persistent concern, with the numbers suggesting this is perhaps viewed less as a headline strategy and more as a structural principle. Meanwhile, donor diversification was deprioritized this cycle, potentially signaling short-term confidence (or complacency) around donor concentration risk.
SHORT TERM PERFORMANCE
This section surfaces near-term shifts across peer groups and portfolio types, helping you track momentum, volatility, and divergence before they show up in long-range trends.
Short Term Performance
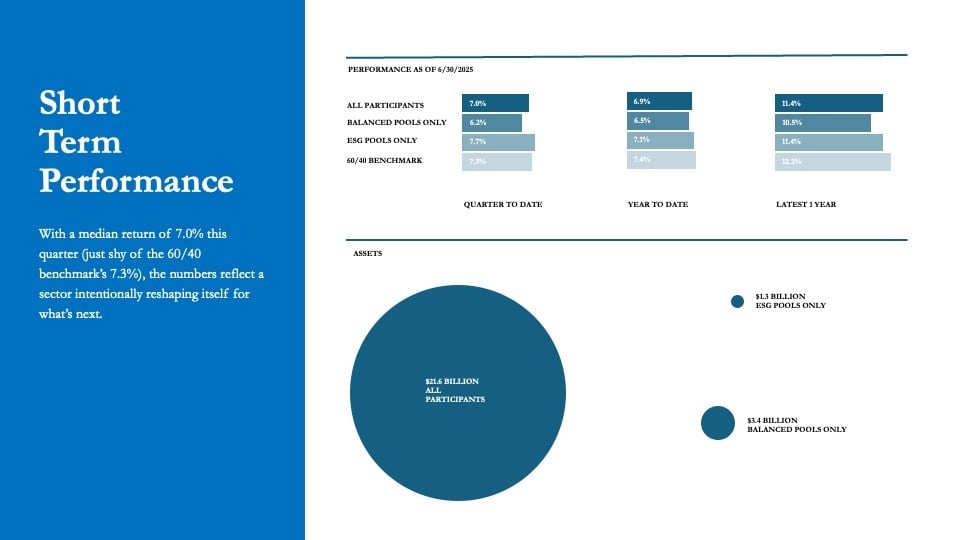
After a stretch of steady gains, Q2 saw modest pullbacks across most foundations. Trailing one-year returns remained positive, and dispersion among size groups narrowed, suggesting a stabilization of sorts. While size was not a major performance driver this quarter, we’re seeing more alignment between portfolio positioning and actual outcomes—particularly among micro and small CFs.
Taken together, these trends reflect a field that remains steady, even as it selectively adjusts to changing conditions.
PERFORMANCE TEARSHEETS
Explore performance and allocation trends by peer group, size, and strategy; then download only what you need. The new middle section surfaces relevant insights across peer groups and sets the stage for future surveys where you can help shape the next questions we dig into together.
- ALL
- X-LARGE
- LARGE
- MEDIUM
- SMALL
- MICRO
- BALANCED
- ESG
Median Performance by Strategy
This snapshot highlights the dispersion in Q2 performance across five dominant investment strategies. While equity-heavy portfolios (≥65%) and those with no alternatives led with median returns of 8.0% and 8.2% respectively, ESG-oriented strategies held their own at 8.0%. Balanced portfolios and those with high alternatives exposure trailed at 6.1% and 6.5%, underscoring the short-term headwinds facing more diversified allocations.
As always, strategy selection is best viewed through a long-term lens. This report surfaces QTD returns—but full lookbacks across 1, 3, 5, 10, 15, and 20-year windows are available in the downloadable dataset.
HISTORICAL ASSET ALLOCATION
This long-view snapshot highlights shifts in asset allocation—revealing trends in equity exposure, diversification into alternatives, and capital preservation strategies across market cycles.
Top-10 S&P 500 Performers
999%
999%
999%
999%
999%
999%
999%
999%
999%
999%
999%
999%
999%
999%
999%
999%
999%
999%
999%
999%
999%
999%
999%
999%
999%
999%
999%
999%
999%
999%
999%
999%
999%
999%
999%
999%
999%
999%
999%
999%
999%
999%
999%
999%
999%
999%
999%
999%
999%
999%
999%
999%
999%
999%
999%
999%
999%
999%
999%
999%
999%
999%
999%
999%
999%
999%
999%
999%
999%
999%
999%
999%
999%
999%
999%
999%
999%
999%
999%
999%
999%
999%
999%
999%
999%
999%
999%
999%
999%
999%
999%
999%
999%
999%
999%
999%
999%
999%
999%
999%
999%
999%
999%
999%
999%
999%
999%
999%
999%
999%
999%
999%
999%
999%
999%
999%
999%
999%
999%
999%
999%
999%
999%
999%
999%
999%
999%
999%
999%
999%
999%
999%
999%
999%
999%
999%
999%
999%
999%
999%
999%
999%
999%
999%
999%
Legend: Company Performance Summary
| Ticker | Name | Highest Rank | Streak | Best ROR |
|---|---|---|---|---|
| AAPL | Apple | 1 | 15 | 999% |
| AMZN | Amazon.com, Inc. | 3 | 9 | 999% |
| BRK/B | Berkshire Hathaway Inc. Class B | 4 | 10 | 999% |
| CVX | Chevron | 4 | 5 | 999% |
| FB | Facebook, Inc. Class A | 4 | 5 | 999% |
| GE | General Electric | 3 | 8 | 999% |
| GOOG | Google Inc. Class A | 4 | 7 | 999% |
| GOOGL | Alphabet Inc. Class A | 4 | 6 | 999% |
| IBM | International Business Machines | 3 | 4 | 999% |
| JNJ | Johnson & Johnson | 4 | 12 | 999% |
| JPM | JP Morgan Chase & Company | 5 | 7 | 999% |
| META | Meta Platforms, Inc. Class A | 6 | 1 | 999% |
| MSFT | Microsoft | 1 | 15 | 999% |
| NVDA | NVIDIA Corporation | 4 | 1 | 999% |
| PFE | Pfizer | 9 | 1 | 999% |
| PG | Procter & Gamble | 5 | 3 | 999% |
| T | AT & T | 7 | 4 | 999% |
| TSLA | Tesla, Inc. | 5 | 2 | 999% |
| UNH | UnitedHealth Group Incorporated | 6 | 1 | 999% |
| V | Visa Inc. Class A | 10 | 1 | 999% |
| WFC | Wells Fargo & Company | 6 | 2 | 999% |
| XOM | Exxon Mobil | 1 | 9 | 999% |
Understanding the Allocation Gap Between Top and Bottom Performers
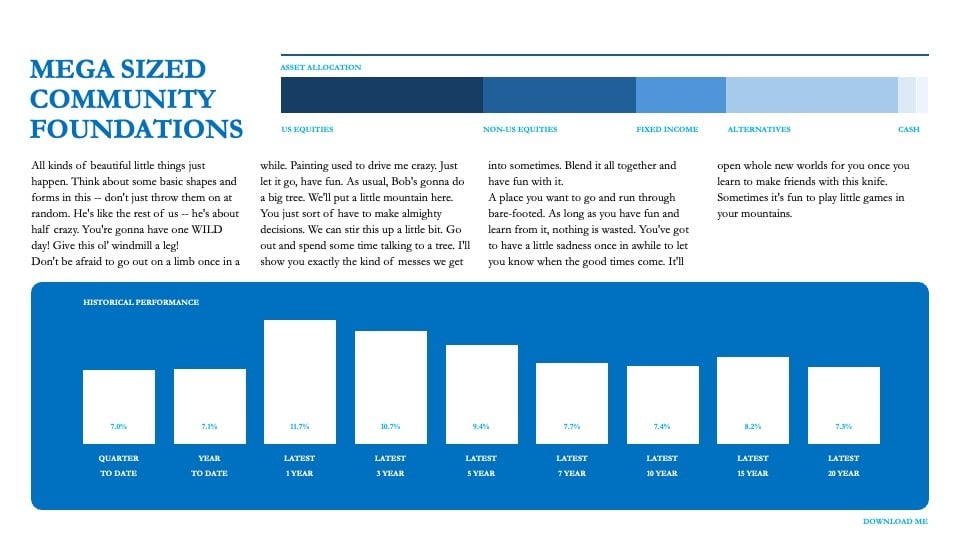
Top-performing community foundations leaned heavily into public equities in Q2 2025—particularly U.S. Large Cap Equity, where their average allocation (40.7%) significantly outpaced that of their bottom-decile peers (22.3%). In contrast, bottom-decile foundations allocated far more to illiquid assets like Private Equity (18.8% vs. 5.1%) and Real Assets (4.1% vs. 0.5%). These differences offer more than just a snapshot of recent positioning—they reflect deeper conviction calls around liquidity, risk tolerance, and timing. While short-term outperformance isn’t necessarily a signal of long-term strategy strength, the data illustrates how tactical tilts toward (or away from) public markets may have impacted Q2 outcomes.


DOWNLOAD PREVIOUS REPORTS
-
2025
-
2024
-
2023
-
DISCLOSURESThe analysis and performance information contained herein reflects that of participants of a performance survey requested by Crewcial Partners, LLC (“Crewcial Partners”), a Securities and Exchange Commission Registered Investment Advisor, and the Fiscal and Administrative Officers Group for Community Foundations (“FAOG”). Peer benchmarking provides important information for foundation boards, investment committees, staff, consultants and donors. This is the only community foundation investment performance survey that Crewcial Partners, LLC is aware of that provides timely quarter-end data across all foundation sizes. For these reasons, and to ensure representation across different portfolio sizes and strategies, participation was encouraged.This information should not be relied upon for tax purposes and is based upon sources believed to be reliable. No guarantee is made to the completeness or accuracy of this information. Crewcial Partners shall not be responsible for any trading decisions, damages, or other losses resulting from, or related to, the information, data, analyses or opinions contained herein or their use, which do not constitute investment advice, are provided as of the date written, are provided solely for informational purposes, and therefore are not an offer to buy or sell a security. This information has not been tailored to suit any individual. Crewcial Partners does not guarantee the results of its advice or recommendations, or that the objectives of a strategy will be achieved. Portfolios offered by Crewcial Partners may not have contained and/or may not currently contain the same underlying holdings and may have been and/or may currently be managed according to rules or restrictions established by Crewcial Partners. All data presented is based on the most recent information available to Crewcial Partners as of the date indicated and may not be an accurate reflection of current data. There is no assurance that the data will remain the same.The presentation contains performance data reported to us. Median returns reflects the approximate deduction of advisory fees, brokerage or other commissions, and any other expenses that a client would have paid. All investments involve the risk of loss, including (among other things) loss of principal, a reduction in earnings (including interest, dividends, and other distributions), and the loss of future earnings. You should consider these risks prior to investing.Benchmark returns are used for comparative purposes only and are not intended to directly parallel the risk or investment style of the accounts included in the composite. The volatility of the indices compared herein may be materially different from that of the compared Crewcial Partners strategy. There is no guarantee that the strategies will outperform, or even match, benchmark returns over the long term.No graph, chart, or formula in this presentation can be used in and of itself to determine which securities to buy or sell, when to buy or sell securities, whether to invest using this investment strategy, or whether to engage Crewcial Partners’s investment advisory services. Performance is calculated on a total return basis and does not include reinvestment of income. Actual fees will vary depending upon, among other things, the applicable fee schedule and portfolio size. These performance presented is based upon survey information that was provided to Crewcial Partners, LLC, and Crewcial Partners, LLC consolidated the information in to this presentation. Overall returns may be reduced by expenses that an investor may incur in the management of the investor’s account, such as for custody or trading services, which will vary by investor. Investments in securities are subject to investment risk, including possible loss of principal. Prices of securities may fluctuate from time to time and may even become valueless. Securities in this report are not FDIC-insured, may lose value, and are not guaranteed by a bank or other financial institution. Before making any investment decision, investors should read and consider all the relevant investment product information. Investors should seriously consider if the investment is suitable for them by referencing their own financial position, investment objectives, and risk profile before making any investment decision. There can be no assurance that any financial strategy will be successful.
Specializing in...
Nullam orci sem, aliquet ac convallis et, ornare vel lorem.
Example Specialty
Interdum et malesuada fames ac ante ipsum primis in faucibus. Quisque hendrerit eleifend lectus, vitae pellentesque lectus molestie sit amet.
Example Specialty
Interdum et malesuada fames ac ante ipsum primis in faucibus. Quisque hendrerit eleifend lectus, vitae pellentesque lectus molestie sit amet.
Example Specialty
Interdum et malesuada fames ac ante ipsum primis in faucibus. Quisque hendrerit eleifend lectus, vitae pellentesque lectus molestie sit amet.
Add Headline Here
Lorem ipsum dolor sit amet, consectetur adipiscing elit.

Example Service
Subheadline goes here
enean ac egestas mi. Mauris eros erat, accumsan eu facilisis non, commodo id lacus. Fusce sodales volutpat nisl lacinia auctor.

Example Service
Subheadline goes here
enean ac egestas mi. Mauris eros erat, accumsan eu facilisis non, commodo id lacus. Fusce sodales volutpat nisl lacinia auctor.

Example Service
Subheadline goes here
enean ac egestas mi. Mauris eros erat, accumsan eu facilisis non, commodo id lacus. Fusce sodales volutpat nisl lacinia auctor.

Example Service
Subheadline goes here
enean ac egestas mi. Mauris eros erat, accumsan eu facilisis non, commodo id lacus. Fusce sodales volutpat nisl lacinia auctor.

Example Service
Subheadline goes here
enean ac egestas mi. Mauris eros erat, accumsan eu facilisis non, commodo id lacus. Fusce sodales volutpat nisl lacinia auctor.

Example Service
Subheadline goes here
enean ac egestas mi. Mauris eros erat, accumsan eu facilisis non, commodo id lacus. Fusce sodales volutpat nisl lacinia auctor.
What Our Clients Say
Food truck jean shorts narwhal, sustainable marfa post-ironic heirloom gluten-free wayfarers you probably.

Cupping chicharrones hexagon vaporware. Helvetica beard taiyaki, DIY drinking vinegar PBR&B tonx vape godard tofu. Meggings echo park taxidermy big mood asymmetrical next level.
John Smith
Director of Marketing

Cupping chicharrones hexagon vaporware. Helvetica beard taiyaki, DIY drinking vinegar PBR&B tonx vape godard tofu. Meggings echo park taxidermy big mood asymmetrical next level.
John Smith
Director of Marketing

Cupping chicharrones hexagon vaporware. Helvetica beard taiyaki, DIY drinking vinegar PBR&B tonx vape godard tofu. Meggings echo park taxidermy big mood asymmetrical next level.
John Smith
Director of Marketing
Add a headline here
Curabitur dignissim mauris et risus efficitur ultrices. Integer porta felis ac sem aliquet pulvinar.
CREWCIAL INSIGHTS
These short reads --complete with optional audio companions-- offer perspective on the investment dilemmas, philosophical tensions, and evolving capital strategies shaping today’s nonprofit landscape. Future editions will continue to reflect the questions and quandaries you raise through our surveys—so if there’s a topic you want us to unpack, speak up. We’re listening.
3 min read
ARE YOU CONFLATING INVESTING WITH GAMBLING?
Michael Miller: Feb 6, 2026
2 min read
THE PROXY PARADOX
Crewcial Partners: Nov 19, 2025


