US
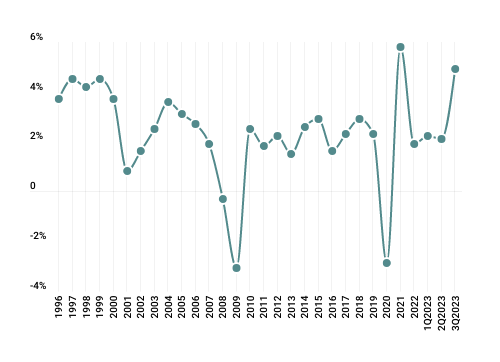
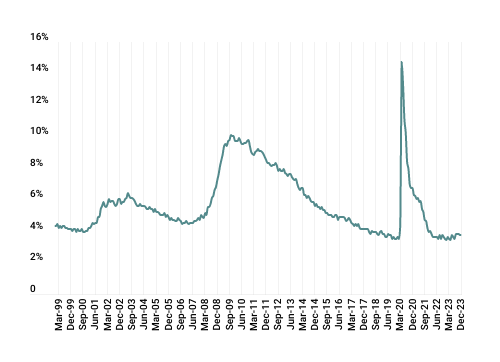
The recession forecasted by economists in late 2022 failed to materialize in 2023, as the US economy, carried by a resilient consumer sector, overcame a remarkable number of macroeconomic headwinds. The US ended the year in the remarkable position of having sustained economic growth, downward trends in inflation, higher interest rates, and steady unemployment. Buoyed by expectations that interest-rate cuts may be imminent, markets ended the year just short of the record highs set in early 2022. Meanwhile, optimism over economic factors and labor supported gains in consumer confidence across all groups. Forward-looking measures of business activity were more middling, with the ISM Services Purchasing Managers' Index (PMI) remaining in expansionary territory but down from earlier in the year, and manufacturing PMIs still in contractionary territory but showing signs of improvement with an uptick in production and employment. Following a difficult internal struggle to elect a new speaker of the house, the US House of Representatives passed another short-term spending bill averting a government shutdown; this was quickly approved by the Senate and signed into law. The stopgap spending bill extends funding for military construction, veterans’ benefits, transportation, housing, urban development, agriculture, the Food and Drug Administration, and energy and water programs through January 19, while remaining silent on contentious spending cuts and border-security measures sought by some Republicans.
The Federal Open Market Committee (FOMC) met in November and December. At both meetings, it agreed to maintain the federal-funds target rate corridor at 5.25-5.50%. At the December meeting, the Summary of Economic Projections (SEP) was updated: the most noteworthy change was that Federal Reserve (Fed) officials decreased the median projection for the federal-funds target rate at the end of 2024 from 5.1% to 4.6%. The FOMC made no changes to its balance-sheet reduction plans ($95 billion per month), but the minutes of the December meeting indicated that the FOMC is soon likely to “begin to discuss the technical factors that would guide a decision to slow the pace of (balance-sheet) runoff”; the Fed’s balance sheet fell from $8.1 trillion to $7.8 trillion to close out 2023.
Among the sectors of the economy most sensitive to rates, the spotlight remains on commercial real estate, as higher interest rates continue to present challenges for commercial real-estate debt reaching maturity. Across all sectors, data-provider Trepp estimates that a total of $550 billion of commercial real-estate loans will come due in 2024, followed by $530 billion in 2025. The extent to which lenders will continue to work with borrowers remains in focus, as borrowers faced with rolling debt face higher debt-service costs upon refinancing. The office sector continues to draw attention, as office delinquencies remain in the headlines. According to Trepp, the CMBS office delinquency rate surged from 1.58% in December 2022 to 5.82% in December 2023. Refinancing office properties continues to prove markedly challenging as lenders continue to exercise caution in this sector.
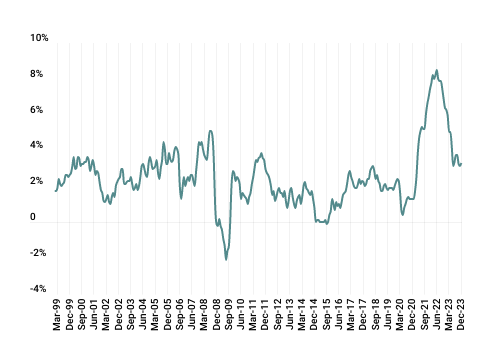
Meanwhile, the residential housing market has maintained its strength despite higher interest rates. Driven by a scarcity of inventory, the S&P CoreLogic Case-Shiller Housing Price Index achieved a record high in October 2023. In December 2023, Fannie Mae’s Home Purchase Sentiment Index reached its highest level since April 2022, driven by softening interest-rate expectations.

![UnderConstruction_shutterstock_415850113 [Converted]](https://www.crewcialpartners.com/hubfs/UnderConstruction_shutterstock_415850113%20%5BConverted%5D.png)