QUARTERLY HIGHLIGHTS


US


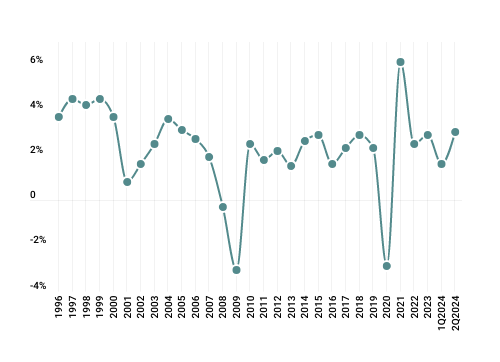
Markets ended the quarter on a high note, as easing inflation allowed policy makers to re-shift their focus towards sustaining growth. Questions about when and by how much the Federal Reverse (the Fed) will cut rates were answered, as the central bank announced its first rate cut since the COVID pandemic. Negative mid-quarter data regarding unemployment and manufacturing activity raised concerns that the US economy may be slowing down and heading towards a hard landing; however, favorable retail sales and inflation data in August alongside higher-than-expected Q2 GDP growth raised hopes that the “soft landing” scenario is indeed achievable.

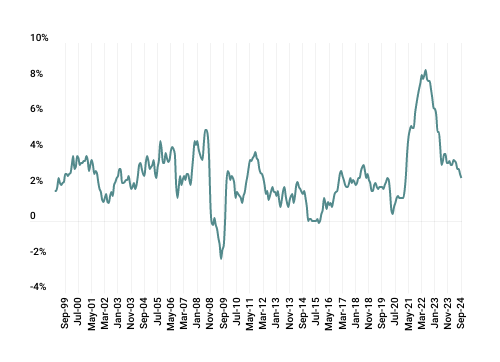
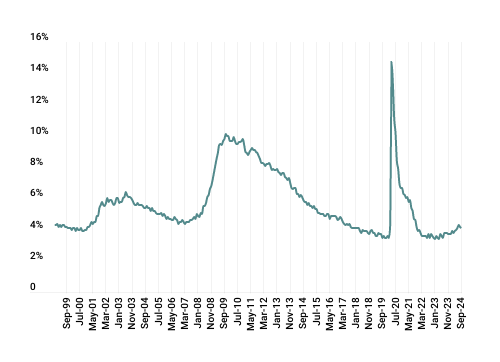
The Federal Open Market Committee (FOMC) met in July and September. The July meeting was not notable, but in September all but one voting FOMC member agreed to reduce the federal-funds target rate corridor by 50 basis points (to 4.75-5.00%); the lone dissenting voice voted for a reduction of 25 bps. The decision to cut by 50 bps (as opposed to a more typical 25 bps) was framed as follows: 1) in order to keep the economic expansion on track; 2) real overnight interest rates are well above the “neutral” rate, even after the cut of 50 bps. In the Summary of Economic Projections (SEP), by the end of 2024, the median Fed expectation for unemployment is an increase from 4.0% to 4.4%, while the expectation for PCE inflation is a decrease from 2.6% to 2.3%. Additionally, and probably most impactful, were the reductions to the median Fed expectations for the federal funds rate at the end of 2024 and 2025, from 5.1% to 4.4% and 4.1% to 3.4%, respectively.

In recent quarters, US business investment activity has shown resilience and growth. Real non-residential fixed investment has grown at a consistent rate of 4-6% per year since 2021, outperforming historical trends and forecasts. In Q3 2024, business investment was predicted to rise by 4.2%, slightly down from 4.5% in 2023, driven by investments in structures, machinery, equipment, and intellectual property. Capital expenditures have been boosted by factors such as AI projects and domestic manufacturing reshoring. Despite elevated interest rates, many firms have continued to invest due to strong returns on capital and available cash reserves.

Commercial real estate continued to face challenges across various sectors during the quarter but displayed some signs of stabilization amid expectations for lower interest rates. The MSCI RCA CPPI National All-Property Index gained 0.6% in August, marking its fourth consecutive monthly rise, and showed a slight year-over-year gain of 0.2%. While the industrial and retail sectors experienced growth overall, the office and multifamily sectors continued to lag.

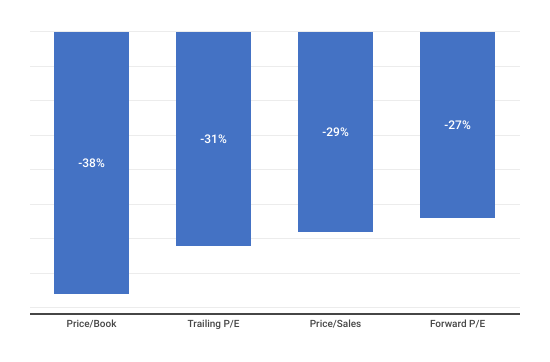
The office sector experienced the steepest declines in value amid rising vacancies and delinquencies. Over the last year, office property values have declined 9.6%, with a notable contrast between those located in central business districts (CBD) and the suburbs. The value of CBD office properties has declined 27.4%, whereas suburban office properties have declined just 4.7%. Over the last three years, the sector’s overall decline reached 20%, with CBD experiencing a staggering 51.3% decline, compared to just 13.3% in suburban areas.


row-spacer
row-spacer
 
EUROPE


In the second quarter of 2024, the Eurozone's GDP grew by 0.2% quarter on quarter, a slight decline from the first quarter. Year on year, its GDP increased by 0.5%, marking the highest growth in five quarters. Germany, the largest economy in the Eurozone, experienced a contraction of 0.1%, while other countries (like Ireland) experienced solid growth. Germany's industrial sector contracted as it worked through a period of high inventory and weak demand. The Eurozone's Manufacturing PMI decreased to 45 from 45.8 in August, indicating continued contraction in the sector. Despite these challenges, input costs declined for the first time since May, while selling prices increased for the first time since April 2022. The Eurozone Services PMI remained in expansionary territory driven by domestic demand and declines in input and output prices.

The European Central Bank (ECB) met twice during the quarter, keeping interest rates steady at its July meeting but cutting by 25 bps in September. Inflation trends in Europe aligned with the ECB’s targeted objective and have shown a significant decline in 2024, falling to 1.8% in September—the Eurozone's lowest rate since April 2021. After the ECB's September rate cut, President Christine Lagarde emphasized the decision to lower the deposit facility rate by 25 bps was based on an updated assessment of the inflation outlook and monetary-policy transmission dynamics. She reiterated the ECB's commitment to ensuring inflation returns to its 2% medium-term target and highlighted a data-dependent, meeting-by-meeting approach without pre-committing to a specific rate path. Lagarde noted the importance of remaining adaptable due to ongoing economic uncertainties and emphasized that policy rates would remain restrictive as long as necessary.

 
CHINA


China’s economic growth in the third quarter showed some encouraging signs but fell short of market expectations. While exports slightly rebounded in September, they remained in negative territory, having declined 6.2% year on year (an improvement from -8.8% in August). This uptick was mainly due to base effects rather than a real increase in external demand. The manufacturing PMI’s new export orders subindex remained below the 50 mark, signaling ongoing contraction. Meanwhile, earlier trends showed imports growing 7.2% year on year in July, marking the strongest growth in three months, but this momentum slowed sharply to just 0.5% in August, below the expected 2%, due to weak domestic demand.

Real-estate investment in China continued to struggle in the third quarter, with property developers hesitant to expand due to liquidity constraints and weak sales. Although property sales showed some signs of stabilization, overall activity remained sluggish. New home prices declined by 6.8% month on month in August, following a 7.6% drop in July. The total value of new homes sold fell by more than 23% through August 2024 compared to the same period last year.

China’s top decision-making body, the Politburo, held two key meetings in the third quarter, highlighting the leadership’s commitment to implementing proactive measures to address economic challenges. These meetings prioritized stabilizing the property sector, which includes measures to support existing- stock acquisition for affordable housing, as well as lowering interest rates on existing mortgages and reducing the minimum down payment for second-home buyers from 25% to 15% to address oversupply issues. Policymakers also committed to new strategies to promote stable growth in the stock market. The measures, along with the stimulus package announced in late September, triggered a surge in Chinese equities, with some China-focused funds seeing returns of over 30% for the month.

 
JAPAN


In Q2 2024, Japan’s economy expanded at an annualized rate of 2.9%, slightly below initial estimates. Capital investment helped Japan’s economy overcome slowing external demand and fluctuations in domestic spending. Real wages, adjusted for inflation, fell by 0.6% in August, reversing gains from earlier in the year due to diminishing contributions from special payments. Despite this, base salary growth marked the largest rise in 32 years at 3%, reflecting spring pay negotiations, providing some optimism about future domestic consumption.

Business sentiment among large manufacturers remained flat in September, as mixed economic conditions across industries was observed by the Bank of Japan’s (BOJ) Tankan Survey. Automakers grappled with weakening overseas sales, particularly in China, while other manufacturers (e.g., electronics) saw a boost from demand for semiconductor equipment. Export growth to the US and China also slowed in September, casting doubt on the strength of the economic recovery. Services remained a bright spot, as hotels and retailers benefited from strong domestic demand due to a surge in tourism.

In July, the BOJ raised benchmark rates by 0.25%. In his commentary, BOJ Gov. Kazuo Ueda stressed the action was a result of the relative solidity of the foundation of the Japanese economy, with gradual price rises accompanied by wage increases. The bank also announced its ‘roadmap for QT,’ stating that it will reduce purchases of Japanese bonds to about ¥3 trillion ($19 billion) per month by the January-March quarter of 2026 (about half of the current ¥6 trillion—$39 billion). Towards the end of September, Shigeru Ishiba, a former defense minister, was elected leader of Japan’s ruling Liberal Democratic Party (LDP) and is set to become the next prime minister. His policy platform focuses on fiscal and security reforms, including the continuation of his predecessor Kishida Fumio's growth-oriented policy and an emphasis on rural revitalization.

 
COMMODITIES


The S&P Goldman Sachs Commodity Index (SPGSCI) ended the quarter down with a total return of -5.26%, generating a significant loss (with a difference of ~600 bps relative to the prior quarter). Precious metals (12.33% – S&P GSCI Precious Metals; SPGSPM) and agriculture (3.68% – S&P GSCI Agriculture; SPGSAG) were the best-performing constituents, while energy (-12.23% – S&P GSCI Energy; SPGSEN) was the largest detractor. Within precious metals, the price of gold achieved solid gains; in agriculture, the price of cocoa, coffee, and sugar rose significantly. Industrial metals benefitted from modest gains in aluminum, copper, and zinc (offset by a decline in lead prices). Within energy, the quarter recognized sharp price declines despite heightened geopolitical tensions in the Middle East, as growth concerns weakened global demand.

The digital-assets markets recognized mixed performance during Q2 2024. The premier digital token, Bitcoin (BTC), appreciated from its Q2 low, recognizing a 1% return for Q3 2024, while the second most-popular digital token, Ethereum (ETH), was down (for a consecutive quarter) 24% over the same period. The former token is up 50% year to date while the latter is up 14%. Supported by Fed rate cuts mid-September, the digital-assets market successfully recovered from drawdowns during the previous month. The main narrative for crypto in 2024, “institutional access,” remained in play during the quarter, as numerous asset managers debuted their Ethereum spot ETFs (exchange traded funds) following regulatory approval. The SEC subsequently approved the listing and trading of options on the Bitcoin ETF, which will lead to market synergies and efficiencies, further embedding crypto in traditional markets.

US:
thecontrol-columnchart-gms-equity-market-performance
The recession forecasted by economists in late 2022 failed to materialize in 2023, as the US economy, carried by a resilient consumer sector, overcame a remarkable number of macroeconomic headwinds.  The US ended the year in the remarkable position of having sustained economic growth, downward trends in inflation, higher interest rates, and steady unemployment. Buoyed by expectations that interest-rate cuts may be imminent, markets ended the year just short of the record highs set in early 2022.  Meanwhile, optimism over economic factors and labor supported gains in consumer confidence across all groups.  Forward-looking measures of business activity were more middling, with the ISM Services Purchasing Managers' Index (PMI) remaining in expansionary territory but down from earlier in the year, and manufacturing PMIs still in contractionary territory but showing signs of improvement with an uptick in production and employment. Following a difficult internal struggle to elect a new speaker of the house, the US House of Representatives passed another short-term spending bill averting a government shutdown; this was quickly approved by the Senate and signed into law. The stopgap spending bill extends funding for military construction, veterans’ benefits, transportation, housing, urban development, agriculture, the Food and Drug Administration, and energy and water programs through January 19, while remaining silent on contentious spending cuts and border-security measures sought by some Republicans.
 
 thecontrol-columnchart-gms-credit-market-performance
The Federal Open Market Committee (FOMC) met in November and December.  At both meetings, it agreed to maintain the federal-funds target rate corridor at 5.25-5.50%.  At the December meeting, the Summary of Economic Projections (SEP) was updated: the most noteworthy change was that Federal Reserve (Fed) officials decreased the median projection for the federal-funds target rate at the end of 2024 from 5.1% to 4.6%.  The FOMC made no changes to its balance-sheet reduction plans ($95 billion per month), but the minutes of the December meeting indicated that the FOMC is soon likely to “begin to discuss the technical factors that would guide a decision to slow the pace of (balance-sheet) runoff”; the Fed’s balance sheet fell from $8.1 trillion to $7.8 trillion to close out 2023.
 
Among the sectors of the economy most sensitive to rates, the spotlight remains on commercial real estate, as higher interest rates continue to present challenges for commercial real-estate debt reaching maturity.  Across all sectors, data-provider Trepp estimates that a total of $550 billion of commercial real-estate loans will come due in 2024, followed by $530 billion in 2025.  The extent to which lenders will continue to work with borrowers remains in focus, as borrowers faced with rolling debt face higher debt-service costs upon refinancing.  The office sector continues to draw attention, as office delinquencies remain in the headlines.  According to Trepp, the CMBS office delinquency rate surged from 1.58% in December 2022 to 5.82% in December 2023.  Refinancing office properties continues to prove markedly challenging as lenders continue to exercise caution in this sector. 
 
Meanwhile, the residential housing market has maintained its strength despite higher interest rates.  Driven by a scarcity of inventory, the S&P CoreLogic Case-Shiller Housing Price Index achieved a record high in October 2023.  In December 2023, Fannie Mae’s Home Purchase Sentiment Index reached its highest level since April 2022, driven by softening interest-rate expectations.
 
EUROPE:

According to data from Eurostat, economic growth across the Eurozone declined (-0.1% quarter over quarter) in the third quarter, as the region faced headwinds from inflation, rising interest rates, and tightened fiscal policies.  Among the larger economies, France, Spain, and Belgium experienced growth while Germany contracted from persistent inflation, high energy prices, and weak foreign demand.  Forward-looking economic indicators weakened for the region; the HCOB's final Composite PMI came in at 47.0.  Manufacturing activity continued to contract and demand for services declined as consumers pulled back on spending.  However, there was some signs of improvement in the manufacturing sub-indices tied to new orders and purchasing activity.  Additionally, Eurozone unemployment remained at a record low of 6.4%; employment increased in both services and construction, offsetting weakness in the manufacturing sector. Overall, job vacancy rates have come down from their peaks but remain relatively high by historical standards.

After declining for much of the past year, the rate of inflation across the Eurozone rose to 2.9% in December. The uptick in inflation was primarily due to technical factors, as the impact of base effects and the timing of government subsidies overwhelmed slower price growth for other goods. (Note, core inflation, which doesn’t include energy, food, alcohol, and tobacco prices, ended the year at 3.4%, down from its 2022 peak.) In its last meeting of the year, the European Central Bank (ECB) reaffirmed its benchmark interest-rate policy and announced plans to phase out the last of its COVID-19 era bond-buying programs. The ECB also changed its language around inflation—from describing it as “expected to remain too high for too long,” to saying that it will “decline gradually over the course of next year.”  In her statements following the meeting, ECB President Christine Lagarde assumed a more measured tone and argued against calls for imminent cuts to interest rates, stating that it’s too early to “lower our guard” and that the bank is “data dependent, not time dependent.”

 
CHINA:

China’s economic data in Q4 2023 presented a mixed picture.  Industrial output experienced a significant rebound, growing by 4.6% (year on year) in October and an impressive 6.6% in November.  This growth—the fastest pace since February 2022—underscored the sector’s recovery and contribution to the economy.  On the other hand, already affected by a downturn in the property sector, reduced land sale revenue, and a slowdown in export manufacturing, consumer spending was further impacted by household deleveraging.  Credit cards and mortgage loans saw a decline, indicating caution among consumers.  Overall spending remained below pre-COVID levels, suggesting a slow and gradual path towards recovery.

In response to the property market's challenges, the Chinese government rolled out several initiatives, including reducing down-payment thresholds and mortgage interest rates, and easing restrictions on second-home purchases.  Such measures were designed to ease financial pressure on homebuyers and stimulate market activity.  Another notable development was the provision of low-cost financing, amounting to CN¥1 trillion, for urban village renovations and affordable housing projects.  This significant investment is intended to support the real-estate sector, a critical component of China's economy.  Early indications suggest a positive reception from homebuyers, particularly in major cities, signaling a potential upturn in the real-estate market.

The November 2023 meeting between Chinese President Xi Jinping and US President Joe Biden was a landmark event.  Key topics included curbing illicit fentanyl production and military cooperation, alongside a dialogue on artificial intelligence emphasizing the importance of managing risks and safety issues.  Described as ‘constructive and productive,’ the meeting underlined both leaders' desire for peaceful coexistence and the necessity of avoiding miscommunication.  While it did not resolve all critical geopolitical issues, the meeting was viewed as a positive step towards stabilizing US-China relations.  The meeting's conciliatory tone and focus on cooperation in specific areas signaled a potential easing of the strained relations between the two nations.


JAPAN:

Japan’s economy contracted at an annualized growth rate of 2.9% in the third quarter, as a decline in private consumption, which makes up more than half the economy, weighed on economic growth. Although nominal salaries rose year over year, higher prices and inflation wiped out the wage growth in real terms, negatively impacting consumers' purchasing power. In November, Prime Minister Fumio Kishida’s administration announced a new economic stimulus package (approximately $113 billion), aimed at helping households with rising costs. The packages included cuts to income and residential taxes, direct benefits to low earners, extended fuel and electricity subsidies, and funds to support the semiconductor sector.

Japanese business sentiment continued to improve during the quarter as measured by the Tankan survey.  Results were especially strong among large manufactures; automakers' moods brightened as the industry benefited from a weak yen and an easing of supply constraints.  Non-manufacturing sentiment was positive as well, improving for the seventh straight quarter; recovering inbound tourism gave a significant boost to non-manufacturers.  Year to date through November, foreign visitors to Japan topped 20 million for the first time since 2019.

December data showed consumer core inflation trending downwards.  Energy and fuel prices declined due to a combination of government subsidies and base effects.  However, services inflation persists, driven primarily by demand for accommodations and food.  The Bank of Japan (BOJ) ended the year with its low-interest polices in place.  In his statement following the BOJ’s December meeting, Governor Kazuo Ueda cooled speculation about future rate hikes, stressing that more data is needed to confirm a positive wage-inflation cycle and the uncertainty surrounding inflation’s sustainability.


COMMODITIES:

The S&P Goldman Sachs Commodity Index (SPGSCI) ended the quarter down with a total return of 10.73%, driven mainly by price gains for industrial metals and precious metals failing to offset weaker prices for energy, agriculture, and livestock.  Contrary to Q3 2023, energy (16.74%; S&P GSCI Energy—SPGSEN) underperformed all other SPGSCI sub-index constituents, with sharply lower prices for crude oil, natural gas, and gas oil.  These detractors to performance occurred despite output cuts from OPEC+. Agriculture (0.73%; S&P GSCI Agriculture—SPGSAG) ended the quarter with higher prices for soybeans, coffee, wheat, and cocoa failing to offset considerable price declines for sugar, corn, cotton, and Kansas wheat.  The precious metals segment outperformed all other commodity constituents during the quarter (10.99%; S&P GSCI Precious Metals—SPGSPM), as both gold and silver achieved robust price gains during Q4 2023.  The industrial metals segment realized a modest gain during the quarter (0.82%; S&P GSCI Industrial Metals—SPGSIM), as prices for aluminum, copper, and zinc offset weaker prices for nickel and lead.   

Following a relatively quiet period in Q2/Q3 2023, the digital-assets market performed well during Q4.  The premier digital token, Bitcoin, was up 57% in Q4 2023, while the second most-popular digital token, Ethereum (ETH), was up 37%, bringing the yearly returns to 155% and 91%, respectively.  Speculation over the approval by the Securities and Exchange Commission (SEC) of a US spot Bitcoin exchange-traded fund (ETF) was a significant driver of price movements during the period; this was subsequently approved in January 2024.


UnderConstruction_shutterstock_415850113 [Converted]
EUROPE

According to data from Eurostat, economic growth across the Eurozone declined (-0.1% quarter over quarter) in the third quarter, as the region faced headwinds from inflation, rising interest rates, and tightened fiscal policies.  Among the larger economies, France, Spain, and Belgium experienced growth while Germany contracted from persistent inflation, high energy prices, and weak foreign demand.  Forward-looking economic indicators weakened for the region; the HCOB's final Composite PMI came in at 47.0.  Manufacturing activity continued to contract and demand for services declined as consumers pulled back on spending.  However, there was some signs of improvement in the manufacturing sub-indices tied to new orders and purchasing activity.  Additionally, Eurozone unemployment remained at a record low of 6.4%; employment increased in both services and construction, offsetting weakness in the manufacturing sector. Overall, job vacancy rates have come down from their peaks but remain relatively high by historical standards.

After declining for much of the past year, the rate of inflation across the Eurozone rose to 2.9% in December. The uptick in inflation was primarily due to technical factors, as the impact of base effects and the timing of government subsidies overwhelmed slower price growth for other goods. (Note, core inflation, which doesn’t include energy, food, alcohol, and tobacco prices, ended the year at 3.4%, down from its 2022 peak.) In its last meeting of the year, the European Central Bank (ECB) reaffirmed its benchmark interest-rate policy and announced plans to phase out the last of its COVID-19 era bond-buying programs. The ECB also changed its language around inflation—from describing it as “expected to remain too high for too long,” to saying that it will “decline gradually over the course of next year.”  In her statements following the meeting, ECB President Christine Lagarde assumed a more measured tone and argued against calls for imminent cuts to interest rates, stating that it’s too early to “lower our guard” and that the bank is “data dependent, not time dependent.”

UnderConstruction_shutterstock_415850113 [Converted]
CHINA

China’s economic data in Q4 2023 presented a mixed picture.  Industrial output experienced a significant rebound, growing by 4.6% (year on year) in October and an impressive 6.6% in November.  This growth—the fastest pace since February 2022—underscored the sector’s recovery and contribution to the economy.  On the other hand, already affected by a downturn in the property sector, reduced land sale revenue, and a slowdown in export manufacturing, consumer spending was further impacted by household deleveraging.  Credit cards and mortgage loans saw a decline, indicating caution among consumers.  Overall spending remained below pre-COVID levels, suggesting a slow and gradual path towards recovery.

In response to the property market's challenges, the Chinese government rolled out several initiatives, including reducing down-payment thresholds and mortgage interest rates, and easing restrictions on second-home purchases.  Such measures were designed to ease financial pressure on homebuyers and stimulate market activity.  Another notable development was the provision of low-cost financing, amounting to CN¥1 trillion, for urban village renovations and affordable housing projects.  This significant investment is intended to support the real-estate sector, a critical component of China's economy.  Early indications suggest a positive reception from homebuyers, particularly in major cities, signaling a potential upturn in the real-estate market.

The November 2023 meeting between Chinese President Xi Jinping and US President Joe Biden was a landmark event.  Key topics included curbing illicit fentanyl production and military cooperation, alongside a dialogue on artificial intelligence emphasizing the importance of managing risks and safety issues.  Described as ‘constructive and productive,’ the meeting underlined both leaders' desire for peaceful coexistence and the necessity of avoiding miscommunication.  While it did not resolve all critical geopolitical issues, the meeting was viewed as a positive step towards stabilizing US-China relations.  The meeting's conciliatory tone and focus on cooperation in specific areas signaled a potential easing of the strained relations between the two nations.

UnderConstruction_shutterstock_415850113 [Converted]
JAPAN

Japan’s economy contracted at an annualized growth rate of 2.9% in the third quarter, as a decline in private consumption, which makes up more than half the economy, weighed on economic growth. Although nominal salaries rose year over year, higher prices and inflation wiped out the wage growth in real terms, negatively impacting consumers' purchasing power. In November, Prime Minister Fumio Kishida’s administration announced a new economic stimulus package (approximately $113 billion), aimed at helping households with rising costs. The packages included cuts to income and residential taxes, direct benefits to low earners, extended fuel and electricity subsidies, and funds to support the semiconductor sector.

Japanese business sentiment continued to improve during the quarter as measured by the Tankan survey.  Results were especially strong among large manufactures; automakers' moods brightened as the industry benefited from a weak yen and an easing of supply constraints.  Non-manufacturing sentiment was positive as well, improving for the seventh straight quarter; recovering inbound tourism gave a significant boost to non-manufacturers.  Year to date through November, foreign visitors to Japan topped 20 million for the first time since 2019.

December data showed consumer core inflation trending downwards.  Energy and fuel prices declined due to a combination of government subsidies and base effects.  However, services inflation persists, driven primarily by demand for accommodations and food.  The Bank of Japan (BOJ) ended the year with its low-interest polices in place.  In his statement following the BOJ’s December meeting, Governor Kazuo Ueda cooled speculation about future rate hikes, stressing that more data is needed to confirm a positive wage-inflation cycle and the uncertainty surrounding inflation’s sustainability.

UnderConstruction_shutterstock_415850113 [Converted]
COMMODITIES

The S&P Goldman Sachs Commodity Index (SPGSCI) ended the quarter down with a total return of 10.73%, driven mainly by price gains for industrial metals and precious metals failing to offset weaker prices for energy, agriculture, and livestock.  Contrary to Q3 2023, energy (16.74%; S&P GSCI Energy—SPGSEN) underperformed all other SPGSCI sub-index constituents, with sharply lower prices for crude oil, natural gas, and gas oil.  These detractors to performance occurred despite output cuts from OPEC+. Agriculture (0.73%; S&P GSCI Agriculture—SPGSAG) ended the quarter with higher prices for soybeans, coffee, wheat, and cocoa failing to offset considerable price declines for sugar, corn, cotton, and Kansas wheat.  The precious metals segment outperformed all other commodity constituents during the quarter (10.99%; S&P GSCI Precious Metals—SPGSPM), as both gold and silver achieved robust price gains during Q4 2023.  The industrial metals segment realized a modest gain during the quarter (0.82%; S&P GSCI Industrial Metals—SPGSIM), as prices for aluminum, copper, and zinc offset weaker prices for nickel and lead.   

Following a relatively quiet period in Q2/Q3 2023, the digital-assets market performed well during Q4.  The premier digital token, Bitcoin, was up 57% in Q4 2023, while the second most-popular digital token, Ethereum (ETH), was up 37%, bringing the yearly returns to 155% and 91%, respectively.  Speculation over the approval by the Securities and Exchange Commission (SEC) of a US spot Bitcoin exchange-traded fund (ETF) was a significant driver of price movements during the period; this was subsequently approved in January 2024.

 
ECONOMIC INDICATORS


GMS_CPI_2024Q3
ROLLING 12-MONTH CONSUMER PRICE INDEX
25 YEARS THROUGH JUNE 2024

The Consumer Price Index for All Urban Consumers (CPI-U) increased 0.2% in September after a similar gain in August, while the all-items index rose 2.4% before seasonal adjustment over the previous twelve months. Over the past twelve months, the primary contributor was shelter (+4.9%), which accounted for nearly 70% of the total increase in the all items less food and energy index. Other notable contributors included transportation services (8.5%) and electricity (4.4%).

GMS_GDP_2024Q3
REAL GROSS DOMESTIC PRODUCT
25 YEARS THROUGH Q1 2024

During Q2 2024, real GDP accelerated, rising at an annual rate of 3%. An uptick in private domestic investment, private inventory investment, and consumer spending (which accounts for more than two-thirds of GDP) were the primary contributors to growth. From an industry perspective, private-goods-producing industries rose 6.9%, private-services-producing industries rose 2.4%, and government rose 0.8%. The one notable detractor was fixed investments (residential), which declined by 2.8%.

CoverImage_GMS_RetailSection
RETAIL SALES

Total retail and food sales increased 0.1% and 2.9% month to date and year to date, respectively, ending August 2024. Total sales from December 2023 through August 2024 were up 2.5% compared to the same period one year prior. Significant positive contributors included miscellaneous store retail, online retail, and food services and drinking places. Furniture store sales, which have fallen, were a notable outlier; the housing market slowdown has impacted consumer spending on home goods.

GMS_UnemploymentRate_2024Q3
Unemployment RATE
25 YEARS THROUGH june 2024

The US economy added 254,000 jobs in September 2024, ahead of the trailing twelve-month average gain of 203,00. September’s job gains occurred within the healthcare and social assistance (+72,400), food services and drinking places (+69,000), healthcare (+45,000), government (+31,000), and construction (+25,000) industries.

The unemployment rate of 4.1% reflects a slight improvement from earlier in the quarter, while the labor-force participation rate (62.7%) was little changed. Both figures are higher than one year earlier (jobless rate of 3.6% and participation rate of 60.1%). Wage growth trends were similarly unchanged, with average hourly earnings for all employees on private non-farm payrolls increasing by 0.4% in June and 4.0% over the past twelve months.

GMS_VIX_2024Q3
CBOE VIX DAILY CLOSING VALUES
LAST 10 YEARS

Market volatility, as measured by the VIX Index, had an average close in Q3 2024 of 17.1, ending the quarter above the relatively low levels experienced in the first half of 2024. The index spiked dramatically in August to a four-year high on investor concerns that the unwinding of yen carry positions would lead to a widespread sell off. However, as the month progressed, decelerating inflation, prospective rate cuts, resilient earnings, and solid economic growth eased investors’ minds and the index ended the quarter below its ten-year average.

 
DOMESTIC EQUITIES


CPI
CPI

The Consumer Price Index for All Urban Consumers (CPI-U) increased 0.3% in December, following a 0.1% increase in November.  The all-items index rose 3.4% before seasonal adjustment over the previous twelve months.  Over the past twelve months, the major contributors include transportation services, up 9.7% (driven by motor-vehicle insurance, up 20.3%), tobacco and smoking products, up 7.8%, and shelter, up 6.2%.

GDP
GDP

During Q3 2023, real GDP rose at an annual rate of 4.9% followed by a 2.1% increase in Q2 2023.  The increase was driven by consumer spending and inventory investment; imports also increased. Overall, 14 of 22 industry groups contributed to real GDP growth in the third quarter; the value added from private goods-producing industries was particularly strong at 10.2%.

Retail Sales
Retail Sales

Total retail and food sales increased 0.3% and 4.1% month-to-date and year-to-date ending November 2023, respectively.  Total sales from September through November 2023 were up 3.4% compared to the same period one year ago; the percentage change over the same period was up 0.4%.  Significant contributors include non-store retailers and food services and drinking places. 

Unemployment
Unemployment
A total of 494,000 jobs were created in the fourth quarter of 2023, which did not outpace the previous quarter’s gains of 710,000.  The US economy added 216,000 jobs in November, which is below the twelve-month average monthly gain of 225,000. December’s notable job gains occurred within the following industries: government (+52,000), health care (+38,000), social assistance (+21,000), and construction (+17,000).
 
The unemployment rate remains unchanged from the previous quarter’s average at 3.7%.  The number of unemployed persons (6.3 million) experienced minimal net movement as well.  The labor force participation rate decreased by 0.3% in December (62.5%).
VIX
VIX

Market volatility, as measured by the VIX Index, had an average close in Q4 2023 at 15.29, trending up from Q3 (15.01) and down from Q2 (16.48).  The index has dropped below its five-year average of 20.58, reflecting positive investor sentiment and a high level of comfort with the overall direction of the economy.

GMS Table Templates
  Q4 2023 YTD   Q4 2023
YTD
Title
0%
0%
Title
0%
0%
Title
0%
0%
Title
0%
0%
Title
0%
0%
Title
0%
0%


  Q4 2023 YTD   Q4 2023
YTD
Large Cap Value
0%
0%
Large Cap Growth
0%
0%
Mid Cap Value
0%
0%
Mid Cap Growth
0%
0%
Small Cap Value
0%
0%
Small Cap Growth
0%
0%


  U.S. Large Cap U.S. Mid Cap U.S. Small Cap
  Q4 2023 YTD Q4 2023 YTD  Q4 2023 
YTD
Title
0%
0%
0%
0%
0%
0%
Title
0%
0%
0%
0%
0%
0%
Title
0%
0%
0%
0%
0%
0%
Title
0%
0%
0%
0%
0%
0%
Title
0%
0%
0%
0%
0%
0%
Title
0%
0%
0%
0%
0%
0%
Title
0%
0%
0%
0%
0%
0%
Title
0%
0%
0%
0%
0%
0%
Title
0%
0%
0%
0%
0%
0%
Title
0%
0%
0%
0%
0%
0%
Title
0%
0%
0%
0%
0%
0%
Title
0%
0%
0%
0%
0%
0%
Title
0%
0%
0%
0%
0%
0%


  Header Header
Header Q4 2023 YTD Q4 2023 YTD 
Title1
0%
0%
0%
0%
Title2
0%
0%
0%
0%
Title3
0%
0%
0%
0%
Title4
0%
0%
0%
0%
Title5
0%
0%
0%
0%


  Header Header
Header Q4 2023 Q4 2023
Title1
0%
0%
Title2
0%
0%
Title3
0%
0%
Title4
0%
0%
Title5
0%
0%


Country Best Performing Style
Title1
Value
Title2
Value
Title3
Value
Title4
Value
Title5
Value
Title6
Value
Title7
Value
Title8
Value
Title9
Value
Title10
Value
Title11
Value
Title12
Value
Title13
Value
Returns by style:
  Q3 2024 YTD   Q3 2024
YTD
Large Cap Value
9.1% 17.6%
Large Cap Value
2.8% 26.4%
Mid Cap Value
10.1% 15.1%
Mid Cap Value
6.5% 12.9%
Small Cap Value
10.2% 9.2%
Small Cap Value
8.4% 13.2%


Returns by style
  Q4 2023 YTD   Q4 2023
YTD
Large Cap Value
0%
0%
Large Cap Value
0%
0%
Mid Cap Value
0%
0%
Mid Cap Value
0%
0%
Small Cap Value
0%
0%
Small Cap Value
0%
0%


  Q4 2023 YTD   Q4 2023
YTD
Large Cap Value
0%
0%
Large Cap Growth
0%
0%
Mid Cap Value
0%
0%
Mid Cap Growth
0%
0%
Small Cap Value
0%
0%
Small Cap Growth
0%
0%


SECTOR Returns BY CAPITALIZATION
  U.S. Large Cap U.S. Mid Cap U.S. Small Cap
  Q4 2023 YTD Q4 2023 YTD  Q4 2023 
YTD
Basic Materials
0%
0%
0%
0%
0%
0%
Consumer Goods
0%
0%
0%
0%
0%
0%
Consumer Services
0%
0%
0%
0%
0%
0%
Financials
0%
0%
0%
0%
0%
0%
Health Care
0%
0%
0%
0%
0%
0%
Industrials
0%
0%
0%
0%
0%
0%
Oil & Gas
0%
0%
0%
0%
0%
0%
Real Estate
0%
0%
0%
0%
0%
0%
Technology
0%
0%
0%
0%
0%
0%
Telecommunications
0%
0%
0%
0%
0%
0%
Utilities
0%
0%
0%
0%
0%
0%
Source: Russell Investments & Industry Classification Benchmark
Large Cap: Russell Top 200 Index | Mid Cap: Russell Mid Cap Index | Small Cap: Russell 2000 Index


us valuations
  Quarter Ending 12/31/2023 Quarter Ending 9/30/2023
US Large Cap Equity Value Growth Value Growth 
Price/Earnings Ratio
0%
0%
0%
0%
IBES LT Growth (%)
0%
0%
0%
0%
1 Year Forward P/E Ratio
0%
0%
0%
0%
Negative Earnings (%)
0%
0%
0%
0%


  Quarter Ending 12/31/2023 Quarter Ending 9/30/2023
US Mid Cap Equity Value Growth Value Growth 
Price/Earnings Ratio
0%
0%
0%
0%
IBES LT Growth (%)
0%
0%
0%
0%
1 Year Forward P/E Ratio
0%
0%
0%
0%
Negative Earnings (%)
0%
0%
0%
0%


  Quarter Ending 12/31/2023 Quarter Ending 9/30/2023
US Small Cap Equity Value Growth Value Growth 
Price/Earnings Ratio
0%
0%
0%
0%
IBES LT Growth (%)
0%
0%
0%
0%
1 Year Forward P/E Ratio
0%
0%
0%
0%
Negative Earnings (%)
0%
0%
0%
0%


international valuations
  Quarter Ending 12/31/2023 Quarter Ending 9/30/2023
International Equity Value Growth Value Growth 
Price/Earnings Ratio
0%
0%
0%
0%
IBES LT Growth (%)
0%
0%
0%
0%
1 Year Forward P/E Ratio
0%
0%
0%
0%
Negative Earnings (%)
0%
0%
0%
0%


  Quarter Ending 12/31/2023 Quarter Ending 9/30/2023
Emerging Markets Equity Value Growth Value Growth 
Price/Earnings Ratio
0%
0%
0%
0%
IBES LT Growth (%)
0%
0%
0%
0%
1 Year Forward P/E Ratio
0%
0%
0%
0%
Negative Earnings (%)
0%
0%
0%
0%
Source: Russell Investments Total Equity Profile


non-us developed / emerging cap & style
  Q4 2023 YTD   Q4 2023
YTD
Large Cap Value
0%
0%
Large Cap Value
0%
0%
Mid Cap Value
0%
0%
Mid Cap Value
0%
0%
Small Cap Value
0%
0%
Small Cap Value
0%
0%


  Header Header
Header Q4 2023 Q4 2023
Title1
0%
0%
Title2
0%
0%
Title3
0%
0%
Title4
0%
0%
Title5
0%
0%


Country Best Performing Style
Australia
Value
Brazil
Value
Canada
Value
China
Value
France
Value
Germany
Value
Hong Kong
Value
Indonesia
Value
Italy
Value
Japan
Value
Mexico
Value
Singapore
Value
Spain
Value
Thailand
Value


SECTOR Returns BY CAPITALIZATION:
  U.S. Large Cap U.S. Mid Cap U.S. Small Cap
  Q3 2024 YTD Q3 2024 YTD  Q3 2024
YTD
Basic Materials
10.8 19.0 4.4 1.6 10.9 9.8
Consumer Goods
8.2 13.5 8.5 9.3 10.5 14.5
Consumer Services
7.1 17.9 7.6 11.5 8.7 7.8
Financials
9.5 23.5 11.6 23.1 15.8 12.3
Health Care
6.4 17.8 7.0 2.5 9.8 11.2
Industrials
12.8 17.7 11.5 18.4 8.6 14.7
Oil & Gas
-3.0 7.3 -0.9 9.9 -8.1 -4.6
Real Estate
19.2 7.7 16.3 16.8 17.6 12.4
Technology
0.8 32.0 3.7 11.2 1.2 11.2
Telecommunications
12.5 19.8 18.6 0.8 38.0 22.0
Utilities
15.2 28.7 18.7 31.9 14.1 12.6
Source: Russell Investments & Industry Classification Benchmark
Large Cap: Russell Top 200 Index | Mid Cap: Russell Mid Cap Index | Small Cap: Russell 2000 Index
 
GLOBAL EQUITIES
GLOBAL EQUITY PERFORMANCE

The MSCI EAFE and Emerging Market indices gained 7.3% and 8.7%, respectively, outpacing US large-cap equities, which rose 5.9%. US and international equity markets had a strong quarter; doveish statements and rate cuts from the Fed and ECB alongside better-than-expected growth data from the US reinforced the “soft-landing” policy narrative. Emerging markets benefited from a late-quarter rally in Chinese equities after authorities in China announced their largest stimulus package since the pandemic, aimed at helping the country’s struggling housing sector.

The MSCI All Country World Index (ACWI) finished the quarter up 6.6%. China (+23.49%) and Thailand (+28.9%) were the top-performing countries, as both markets benefited from new government stimulus packages. Turkey was the worst-performing emerging market (-12.55%), as a tight monetary policy negatively affected corporate profits. In Europe, Belgium (+15.25%) was the best-performing market, aided by the strong performance of healthcare/biotech companies; conversely, Denmark was the worst-performing market (largely due to the performance of Novo Nordisk over the quarter).


row-spacer
row-spacer
US VALUATIONS

US equities are expected to grow earnings by 4.2% for Q3 2024. Overall, eight of the eleven sectors are projected to increase earnings, led by technology (+15%), healthcare (+11%), and communication services (+11%). Conversely, energy (-21%), materials (-3%), and financials (-1%) are expected to post declines. Looking ahead, analysts’ estimates currently predict earnings and revenue growth of 10% and 5%, respectively, for calendar-year 2024.

Price multiples expanded modestly for large- and mid-cap equities across styles; however, they were mixed across small cap, where growth equities experienced modest contraction while value equities saw multiple expansion. On a normalized basis, the S&P 500 Index remains expensively priced, trading at a cyclically adjusted P/E (CAPE) more than two standard deviations above its long-term average.

  Quarter Ending 9/30/2024 Quarter Ending 6/30/2024
US Large Cap Equity Value Growth Value Growth 
Price/Earnings Ratio
23.8 40.0 22.0 37.1
IBES LT Growth (%)
9.2 19.9 9.3 19.4
1 Year Forward P/E Ratio
17.2 30.3 16.3 30.3
Negative Earnings (%)
5.7 1.8 6.6 1.3


  Quarter Ending 9/30/2024 Quarter Ending 6/30/2023
US Mid Cap Equity Value Growth Value Growth 
Price/Earnings Ratio
23.3 41.9 22.4 35.3
IBES LT Growth (%)
8.7 15.9 9.2 14.0
1 Year Forward P/E Ratio
16.6 26.5 16.1 25.8
Negative Earnings (%)
8.2 10.8 9.4 9.0


  Quarter Ending 9/30/2024 Quarter Ending 6/30/2023
US Small Cap Equity Value Growth Value Growth 
Price/Earnings Ratio
28.1 18.0 24.5 65.4
IBES LT Growth (%)
8.4 14.4 8.6 14.0
1 Year Forward P/E Ratio
12.7 19.5 11.9 19.8
Negative Earnings (%)
25.4 33.0 23.5 28.0
INTERNATIONAL VALUATIONS

Non-US developed growth equities registered modest multiple compression during the quarter, while valuations for international value equities increased. On both an absolute and relative basis, international equities continue to trade at a discount relative to historical averages (as compared to US equities). Emerging-market valuations trended slightly higher in Q1, although they remain cheap on both an absolute and relative basis.

Europe is expected to increase earnings by 5% in 2024 and 10% in 2025, while Japan’s earnings are expected to increase 13% and 9%, respectively. The broader emerging markets are expected to grow by 20% and 15%, respectively, in 2024 and 2025.

  Quarter Ending 9/30/2024 Quarter Ending 6/30/2023
International Equity Value Growth Value Growth 
Price/Earnings Ratio
13.3 24.7 13.7 25.5
IBES LT Growth (%)
7.1 13.4 6.5 12.1
1 Year Forward P/E Ratio
10.9 21.8 10.5 23.1
Negative Earnings (%)
7.0 4.3 4.7 2.8


Emerging Markets Equity Quarter Ending 9/30/2024 Quarter Ending 6/30/2023
Price/Earnings Ratio
18.0 17.3
IBES LT Growth (%)
15.8 16.6
1 Year Forward P/E Ratio
13.9 13.8
Negative Earnings (%)
3.9 4.4
Source: Russell Investments Total Equity Profile


non-us developed / emerging cap & style: MSCI AC WORLD EX - US INDICES
(SOURCE: MSCI - DATA SOURCED 'AS IS')
  Q3 2024 YTD   Q3 2024
YTD
Large Cap Value
9.1% 15.0% Large Cap Growth 6.3% 14.6%
Mid Cap Value
9.7% 12.2% Mid Cap Growth 9.6% 11.6%
Small Cap Value
9.4% 12.7% Small Cap Growth 8.5% 11.2%
Country Best Performing Style
Australia Value
Brazil Growth
Canada Value
China Value
France Value
Germany Value
Hong Kong Growth
Indonesia Value
Italy Growth
Japan Growth
Mexico Value
Singapore Growth
Spain Growth
Thailand Growth
United Kingdom Growth


HEDGE FUNDS
HEDGE FUND PERFORMANCE
 
PRIVATE EQUITY
PRIVATE EQUITY PERFORMANCE
 
FIXED INCOME
US SPREAD PRODUCTS

The investment-grade corporate bond market returned 5.8% for the quarter. The positive return was mostly due to significant declines in interest rates. This market’s option-adjusted spread (OAS) tightened by 5 bps to end the quarter at 89 bps, 31 bps below the ten-year median spread (120 bps) and near its tightest levels this century. Performance by credit quality favored lower-quality issues: Baa- and A-rated corporates, +5.8%; Aa-rated corporates, +4.9%. This market’s issuance totaled approximately $425 billion for the quarter, a 46% increase from the corresponding period in 2023.

The high-yield corporate-bond market returned 5.3% for the quarter. The positive return was mostly due to significant declines in interest rates. This market’s OAS tightened by 14 bps to end the quarter at 295 bps, 94 bps below the ten-year median spread (389 bps) and near its tightest levels this century. Performance by credit quality favored lower-quality issues: Caa-rated corporates, +10.2%; B-rated corporates, +4.5%; Ba-rated corporates, +4.3%. This market’s issuance totaled approximately $80 billion for the quarter, an increase of 95% from the corresponding period in 2023.

Russell2000_shutterstock_2294146949

hello world


test-4-gms
GDP

During Q3 2023, real GDP rose at an annual rate of 4.9% followed by a 2.1% increase in Q2 2023.  The increase was driven by consumer spending and inventory investment; imports also increased. Overall, 14 of 22 industry groups contributed to real GDP growth in the third quarter; the value added from private goods-producing industries was particularly strong at 10.2%.

test-4-gms
Retail Sales

Total retail and food sales increased 0.3% and 4.1% month-to-date and year-to-date ending November 2023, respectively.  Total sales from September through November 2023 were up 3.4% compared to the same period one year ago; the percentage change over the same period was up 0.4%.  Significant contributors include non-store retailers and food services and drinking places. 

test-4-gms
Unemployment

A total of 494,000 jobs were created in the fourth quarter of 2023, which did not outpace the previous quarter’s gains of 710,000.  The US economy added 216,000 jobs in November, which is below the twelve-month average monthly gain of 225,000.  December’s notable job gains occurred within the following industries: government (+52,000), health care (+38,000), social assistance (+21,000), and construction (+17,000).

The unemployment rate remains unchanged from the previous quarter’s average at 3.7%.  The number of unemployed persons (6.3 million) experienced minimal net movement as well.  The labor force participation rate decreased by 0.3% in December (62.5%).

test-4-gms
VIX

During Q2 2023, real GDP rose at an annual rate of 2.1%, following a 2.2% increase in Q1. The increase was driven by state and local government spending, non-residential fixed investment, and consumer spending, partially offset by a decrease in exports; imports also decreased. Relative to Q1, the second quarter experienced a slowdown in consumer and federal government spending alongside the decline in exports, which drove the Q2 deceleration of real GDP.

 
MID CAP VALUE VS. GROWTH
ROLLING 1-YEAR PERFORMANCE VS. RUSSELL 2000
12/31/2013 TO 12/31/2023

LARGE CAP VALUE VS. GROWTH
 
ROLLING 1-YEAR PERFORMANCE VS. RUSSELL 2000
 
12/31/2013 TO 12/31/2023
 
 
Charts
YIELD CURVE

The US Treasury yield curve fell in a dramatic bull-steepening fashion during the quarter. Yields decreased by approximately 75-100 bps from the two- to the five-year note, and by approximately 40-65 bps from the seven-year note to the 30-year bond. The two- to ten-year spread returned to a positive slope, increasing by 50 bps (to +15 bps) and ending a record two-year inversion. The triggers for the market’s strong bid for treasuries, particularly for the maturities on the front-end and in the belly of the curve, included the magnitude of the negative revision to the non-farm payrolls report (-818,000 or 30% lower than initially reported) and the continued softening of inflation data (the trailing three-month annualized CPI was 1.1% as of August 2024).

At the end of the third quarter, the federal-funds futures market predicted a target rate of 4.2% by the end of 2024—this is approximately 20 bps below the expectation of Fed officials (4.4%).

GMS_TreasuryYields_2024Q3


GMS_TreasuryYieldCurve_2024Q3


Love these and want more?

Enter your email address below and we will let you know when we add new resources.