QUARTERLY HIGHLIGHTS


US


The quarter opened in the shadow of the prior period's geopolitical shock; however, investor anxiety over the conflict with Iran and the closure of the Strait of Hormuz receded quickly, ceding center stage to artificial intelligence and the widening cast of its perceived beneficiaries. During the quarter, major hyperscalers collectively committed to near-term capital plans exceeding $700 billion, positioning AI infrastructure as the dominant driver of US fixed investment and a gravitational force in the economy. The theme was reinforced when Anthropic reported second-quarter revenue of $10.9 billion, more than double its first-quarter result and greater than its sales for all of the prior year. A recent Gallup poll found that 47% of US employees now say their organization has integrated AI tools, with 15% using AI in their role daily, suggesting the theme may be maturing from experimentation to implementation.
 
The quarter's defining capital-markets event was the June 12th public debut of SpaceX, which was priced at $135 per share and raised approximately $75 billion before the overallotment, eclipsing Saudi Aramco's 2019 listing (by nearly threefold) to become the largest IPO in history. The stock opened near $150 and climbed close to 20% in its first session. It briefly carried a market capitalization above $2 trillion, ranking it among the most valuable companies in the world. The offering was also notable for an unusually large retail allocation of roughly 30% of available shares, against reported retail orders exceeding $100 billion. More consequential for portfolio construction than the headline valuation, however, were the mechanics that followed. Under a Nasdaq rule adopted earlier this year that compresses the seasoning period for large offerings to 15 trading days, SpaceX entered the Nasdaq 100 on July 7th, days after quarter-end, the fastest major index inclusion on record, obligating the more than $800 billion of assets tracking that benchmark to hold the stock. JP Morgan estimated roughly $4.3 billion of forced buying through the QQQ ETF alone, with total Nasdaq-100-linked passive flows of $22-27 billion, demand that had to be funded by proportionate selling of existing index constituents, colliding with a constrained public float. While the IPO's long-term impact is yet to be determined, the second half of 2026 is widely expected to include the IPOs of several leading AI companies, most notably Anthropic.
 
The Federal Open Market Committee (“FOMC”) met in April and June. At each meeting the FOMC maintained the federal funds target range in a corridor of 3.50-3.75%. The June meeting was the first led by the new chair of the Federal Reserve ("Fed"), Kevin Warsh, who not only guided the FOMC to deliver an uncharacteristically terse monetary policy statement, but also declined to submit a forecast for future fed funds rates. In the post-meeting press conference, Warsh foreshadowed that he intended to reform the central bank. While he firmly committed to maintaining its 2% inflation target, he implied he was likely to severely curtail or even discontinue the long-standing policy of providing markets with forward guidance; Warsh also communicated his intention to improve the analysis and interpretation of data inputs. The balance sheet remained stable near $6.8 trillion. Federal-funds futures predict a 4.0% rate by year-end 2026, approximately 20 bps above the median projection (3.8%).
 
Within private debt markets, investor attention during the second quarter increasingly centered on valuation transparency alongside underlying credit fundamentals. Widely publicized differences in the marks assigned to the same private loans by large funds highlighted the inherent subjectivity of fair-value methodologies, renewing debate over valuation practices in an increasingly opaque market.
 
Software remained a key area of focus as concerns grew that AI-driven disruption could impair the long-term creditworthiness of legacy software companies. Liquidity also came under greater scrutiny amid heightened redemption activity at non-traded BDCs and evergreen private-credit vehicles. Against this backdrop, the growing prevalence of payment-in-kind (PIK) interest suggests reported default rates may understate underlying borrower stress.

row-spacer
row-spacer
 
EUROPE


The euro area entered the second quarter on weaker footing than initially expected, with real GDP contracting by 0.2% quarter-on-quarter in Q1 2026, following growth of 0.2% in the prior quarter. The decline was driven primarily by a sharp contraction in Ireland, as its pharmaceutical sector, dominated by multinationals, reversed some of the export strength recorded in late 2025. France also contracted modestly (-0.1%), reflecting continued weakness in domestic and external demand. Meanwhile, Spain maintained its position as one of the region's stronger large economies, supported by resilient household consumption, another strong tourist season, and continued investment funded through the European Union's Recovery and Resilience Facility. Among smaller economies, Denmark, Estonia, and Malta recorded the strongest gains, benefiting from strength in specialized exports and services industries.

Economic surveys throughout the second quarter continued to point to a significant divergence between the manufacturing and services sectors. The HCOB Eurozone Manufacturing PMI remained in expansion territory throughout much of the quarter and closed June at 51.4, capping the sector's strongest quarterly performance since early 2022. Factory output and new orders improved, supported in part by inventory building and efforts to get ahead of potential supply disruptions and future price increases. However, the Services PMI fell below the 50 threshold during the quarter, reaching 47.7 in May before recovering somewhat in June. The Composite PMI ended the quarter around 50, consistent with broadly stagnant private-sector activity.

At its June meeting, the European Central Bank (“ECB”) raised its three key policy rates by 25 basis points, lifting the deposit facility rate from 2.00% to 2.25%, its first increase since the 2022-2023 hiking cycle. The move reflected policymakers' ongoing concerns about the buildup in inflation pressures associated with the Middle East conflict and higher energy prices. The ECB raised its forecast for average headline inflation to 3.0% in 2026 and lowered its growth forecast to 0.8%, acknowledging that the energy shock was likely to weigh on real incomes and confidence even as it increased the risk of broader second-round inflation effects. In her commentary after the meeting, President Christine Lagarde emphasized that the Governing Council would "follow a data-dependent and meeting-by-meeting approach to determining the appropriate monetary policy stance," while adding that the ECB was "not pre-committing to a particular rate path." The decision therefore appeared intended to reinforce the ECB's inflation-fighting credibility without necessarily signaling the beginning of an extended tightening cycle.

 
CHINA


China's economy expanded 4.3% year over year in the second quarter, moderating from 5.0% growth in the first quarter but outpacing most developed economies. Growth remained uneven, with resilient manufacturing output and exports, particularly in electric vehicles, batteries, semiconductors, and other advanced manufacturing sectors, offsetting softer domestic demand. Household consumption and private investment remained subdued amid ongoing weakness in the property sector and cautious consumer sentiment. Unlike many countries, China was relatively insulated from the oil supply shock due to the war in the Strait of Hormuz. After building crude oil inventories to an estimated 1.4 billion barrels through 2025, Chinese refiners drew on existing stockpiles rather than increasing purchases at elevated prices. As a result, crude imports declined to approximately 7.1 million barrels per day in June, more than 40% below year-earlier levels and the lowest level in nearly a decade.

Chinese monetary policy remained accommodative but measured, with the People's Bank of China ("PBOC") leaving benchmark lending rates and reserve requirement ratios unchanged while relying on targeted liquidity injections and structural lending programs to support priority sectors, including advanced manufacturing and technology. Fiscal policy likewise remained focused on long-term investment rather than broad-based stimulus, as Beijing reaffirmed plans to invest more than 7 trillion yuan (approximately US$1 trillion) in infrastructure and public services during 2026. Policymakers also continued directing capital toward strategic industries including AI infrastructure, advanced manufacturing, and electric vehicles, reflecting Beijing's continued preference for targeted investment and industrial policy over broad-based economic stimulus.

Artificial intelligence was an ongoing point of friction between the United States and China, as both countries advanced policies that viewed AI leadership as both commercially and strategically important. The United States sought to further limit China's access to the most advanced AI chips and models, including closing potential export-control loopholes, while selectively permitting limited sales of certain lower-tier AI processors under license. At the same time, China moved to restrict foreign technology, including semiconductors, from its critical infrastructure. This suggests the two countries may build increasingly separate AI ecosystems.

 
JAPAN


Japan's economy picked up momentum in the first quarter, with the Cabinet Office's revised GDP release showing real output rising +0.5% quarter-on-quarter, equivalent to an annualized pace of +1.8%. Growth was led by external demand, as net exports increased, and an increase in public spending. Private consumption also advanced +0.3%, supported by rising wages, while business investment declined -0.7%, tempering the strength of the headline result. Despite the softer capital-spending data, business confidence improved during the second quarter: the June Tankan survey from the Bank of Japan ("BOJ") showed sentiment among large manufacturers rising to +22 from +17, its highest level in eight years, while confidence among large non-manufacturers edged up to +37. Strong semiconductor and AI-related demand, and firms' ability to pass through higher costs, supported sentiment, although both companies and consumers noted concerns about rising prices.

At its June meeting, the BOJ raised its policy rate by 25 basis points to 1.0%, the first time rates have reached that level since 1995, as persistent inflation and yen weakness overcame policymakers' residual caution. Governor Kazuo Ueda was absent from the meeting due to hospitalization, and Deputy Governor Shinichi Uchida fronted the post-decision press conference, maintaining the Bank's characteristic caution on forward guidance by reiterating that further decisions remain data-dependent and contingent on how geopolitical and domestic conditions evolve. On the fiscal side, the Takaichi administration moved to cushion households from the inflationary impact of elevated energy import costs, including a gasoline subsidy reserve and direct electricity and gas subsidies for July through September, as part of the supplementary budget passed in June.

 
COMMODITIES


The S&P Goldman Sachs Commodity Index (SPGSCI) reversed course in Q2 2026, declining on a total return basis by approximately 8%, giving back a portion of the prior quarter's monumental, geopolitically-driven gain as the Middle East conflict began to de-escalate. Energy (S&P GSCI Energy; SPGSEN) drove the retracement, with crude oil prices falling by roughly 38% over the quarter after a memorandum of understanding between the US and Iran raised expectations for a reopening of the Strait of Hormuz and an easing of the supply disruption that had fueled Q1's surge. Precious metals (S&P GSCI Precious Metals; SPGSPM) also declined, falling more than 10%, as the currency-debasement trade that had powered gold and silver's earlier rally lost momentum and markets grew more confident that the Fed, under incoming Chair Kevin Warsh, remains committed to price stability, tempering safe-haven demand. Industrial metals were a comparative bright spot, advancing on continued technology- and infrastructure-related demand, including copper, while agriculture (S&P GSCI Agriculture; SPGSAG) and livestock constituents registered mixed, generally modest results for the period.

The quarter reflected two competing narratives for digital assets: the continued development of digital asset infrastructure, including expanding tokenization of equities and real-world assets on-chain, set against near-term price action still driven primarily by macro-driven investor behavior. Initially, Bitcoin staged a recovery from a difficult first quarter, rallying to nearly $82,000 alongside a broader easing in geopolitical anxiety. However, that recovery reversed later in the quarter as oil prices spiked anew on oscillating US-Iran diplomatic developments, US rate expectations shifted, and capital rotated toward AI-related equities. Bitcoin ultimately ended the quarter down approximately 10%, with Ethereum and Solana declining roughly 20% and 13%, respectively.

US:
thecontrol-columnchart-gms-equity-market-performance
The recession forecasted by economists in late 2022 failed to materialize in 2023, as the US economy, carried by a resilient consumer sector, overcame a remarkable number of macroeconomic headwinds.  The US ended the year in the remarkable position of having sustained economic growth, downward trends in inflation, higher interest rates, and steady unemployment. Buoyed by expectations that interest-rate cuts may be imminent, markets ended the year just short of the record highs set in early 2022.  Meanwhile, optimism over economic factors and labor supported gains in consumer confidence across all groups.  Forward-looking measures of business activity were more middling, with the ISM Services Purchasing Managers' Index (PMI) remaining in expansionary territory but down from earlier in the year, and manufacturing PMIs still in contractionary territory but showing signs of improvement with an uptick in production and employment. Following a difficult internal struggle to elect a new speaker of the house, the US House of Representatives passed another short-term spending bill averting a government shutdown; this was quickly approved by the Senate and signed into law. The stopgap spending bill extends funding for military construction, veterans’ benefits, transportation, housing, urban development, agriculture, the Food and Drug Administration, and energy and water programs through January 19, while remaining silent on contentious spending cuts and border-security measures sought by some Republicans.
 
 thecontrol-columnchart-gms-credit-market-performance
The Federal Open Market Committee (FOMC) met in November and December.  At both meetings, it agreed to maintain the federal-funds target rate corridor at 5.25-5.50%.  At the December meeting, the Summary of Economic Projections (SEP) was updated: the most noteworthy change was that Federal Reserve (Fed) officials decreased the median projection for the federal-funds target rate at the end of 2024 from 5.1% to 4.6%.  The FOMC made no changes to its balance-sheet reduction plans ($95 billion per month), but the minutes of the December meeting indicated that the FOMC is soon likely to “begin to discuss the technical factors that would guide a decision to slow the pace of (balance-sheet) runoff”; the Fed’s balance sheet fell from $8.1 trillion to $7.8 trillion to close out 2023.
 
Among the sectors of the economy most sensitive to rates, the spotlight remains on commercial real estate, as higher interest rates continue to present challenges for commercial real-estate debt reaching maturity.  Across all sectors, data-provider Trepp estimates that a total of $550 billion of commercial real-estate loans will come due in 2024, followed by $530 billion in 2025.  The extent to which lenders will continue to work with borrowers remains in focus, as borrowers faced with rolling debt face higher debt-service costs upon refinancing.  The office sector continues to draw attention, as office delinquencies remain in the headlines.  According to Trepp, the CMBS office delinquency rate surged from 1.58% in December 2022 to 5.82% in December 2023.  Refinancing office properties continues to prove markedly challenging as lenders continue to exercise caution in this sector. 
 
Meanwhile, the residential housing market has maintained its strength despite higher interest rates.  Driven by a scarcity of inventory, the S&P CoreLogic Case-Shiller Housing Price Index achieved a record high in October 2023.  In December 2023, Fannie Mae’s Home Purchase Sentiment Index reached its highest level since April 2022, driven by softening interest-rate expectations.
 
EUROPE:

According to data from Eurostat, economic growth across the Eurozone declined (-0.1% quarter over quarter) in the third quarter, as the region faced headwinds from inflation, rising interest rates, and tightened fiscal policies.  Among the larger economies, France, Spain, and Belgium experienced growth while Germany contracted from persistent inflation, high energy prices, and weak foreign demand.  Forward-looking economic indicators weakened for the region; the HCOB's final Composite PMI came in at 47.0.  Manufacturing activity continued to contract and demand for services declined as consumers pulled back on spending.  However, there was some signs of improvement in the manufacturing sub-indices tied to new orders and purchasing activity.  Additionally, Eurozone unemployment remained at a record low of 6.4%; employment increased in both services and construction, offsetting weakness in the manufacturing sector. Overall, job vacancy rates have come down from their peaks but remain relatively high by historical standards.

After declining for much of the past year, the rate of inflation across the Eurozone rose to 2.9% in December. The uptick in inflation was primarily due to technical factors, as the impact of base effects and the timing of government subsidies overwhelmed slower price growth for other goods. (Note, core inflation, which doesn’t include energy, food, alcohol, and tobacco prices, ended the year at 3.4%, down from its 2022 peak.) In its last meeting of the year, the European Central Bank (ECB) reaffirmed its benchmark interest-rate policy and announced plans to phase out the last of its COVID-19 era bond-buying programs. The ECB also changed its language around inflation—from describing it as “expected to remain too high for too long,” to saying that it will “decline gradually over the course of next year.”  In her statements following the meeting, ECB President Christine Lagarde assumed a more measured tone and argued against calls for imminent cuts to interest rates, stating that it’s too early to “lower our guard” and that the bank is “data dependent, not time dependent.”

 
CHINA:

China’s economic data in Q4 2023 presented a mixed picture.  Industrial output experienced a significant rebound, growing by 4.6% (year on year) in October and an impressive 6.6% in November.  This growth—the fastest pace since February 2022—underscored the sector’s recovery and contribution to the economy.  On the other hand, already affected by a downturn in the property sector, reduced land sale revenue, and a slowdown in export manufacturing, consumer spending was further impacted by household deleveraging.  Credit cards and mortgage loans saw a decline, indicating caution among consumers.  Overall spending remained below pre-COVID levels, suggesting a slow and gradual path towards recovery.

In response to the property market's challenges, the Chinese government rolled out several initiatives, including reducing down-payment thresholds and mortgage interest rates, and easing restrictions on second-home purchases.  Such measures were designed to ease financial pressure on homebuyers and stimulate market activity.  Another notable development was the provision of low-cost financing, amounting to CN¥1 trillion, for urban village renovations and affordable housing projects.  This significant investment is intended to support the real-estate sector, a critical component of China's economy.  Early indications suggest a positive reception from homebuyers, particularly in major cities, signaling a potential upturn in the real-estate market.

The November 2023 meeting between Chinese President Xi Jinping and US President Joe Biden was a landmark event.  Key topics included curbing illicit fentanyl production and military cooperation, alongside a dialogue on artificial intelligence emphasizing the importance of managing risks and safety issues.  Described as ‘constructive and productive,’ the meeting underlined both leaders' desire for peaceful coexistence and the necessity of avoiding miscommunication.  While it did not resolve all critical geopolitical issues, the meeting was viewed as a positive step towards stabilizing US-China relations.  The meeting's conciliatory tone and focus on cooperation in specific areas signaled a potential easing of the strained relations between the two nations.


JAPAN:

Japan’s economy contracted at an annualized growth rate of 2.9% in the third quarter, as a decline in private consumption, which makes up more than half the economy, weighed on economic growth. Although nominal salaries rose year over year, higher prices and inflation wiped out the wage growth in real terms, negatively impacting consumers' purchasing power. In November, Prime Minister Fumio Kishida’s administration announced a new economic stimulus package (approximately $113 billion), aimed at helping households with rising costs. The packages included cuts to income and residential taxes, direct benefits to low earners, extended fuel and electricity subsidies, and funds to support the semiconductor sector.

Japanese business sentiment continued to improve during the quarter as measured by the Tankan survey.  Results were especially strong among large manufactures; automakers' moods brightened as the industry benefited from a weak yen and an easing of supply constraints.  Non-manufacturing sentiment was positive as well, improving for the seventh straight quarter; recovering inbound tourism gave a significant boost to non-manufacturers.  Year to date through November, foreign visitors to Japan topped 20 million for the first time since 2019.

December data showed consumer core inflation trending downwards.  Energy and fuel prices declined due to a combination of government subsidies and base effects.  However, services inflation persists, driven primarily by demand for accommodations and food.  The Bank of Japan (BOJ) ended the year with its low-interest polices in place.  In his statement following the BOJ’s December meeting, Governor Kazuo Ueda cooled speculation about future rate hikes, stressing that more data is needed to confirm a positive wage-inflation cycle and the uncertainty surrounding inflation’s sustainability.


COMMODITIES:

The S&P Goldman Sachs Commodity Index (SPGSCI) ended the quarter down with a total return of 10.73%, driven mainly by price gains for industrial metals and precious metals failing to offset weaker prices for energy, agriculture, and livestock.  Contrary to Q3 2023, energy (16.74%; S&P GSCI Energy—SPGSEN) underperformed all other SPGSCI sub-index constituents, with sharply lower prices for crude oil, natural gas, and gas oil.  These detractors to performance occurred despite output cuts from OPEC+. Agriculture (0.73%; S&P GSCI Agriculture—SPGSAG) ended the quarter with higher prices for soybeans, coffee, wheat, and cocoa failing to offset considerable price declines for sugar, corn, cotton, and Kansas wheat.  The precious metals segment outperformed all other commodity constituents during the quarter (10.99%; S&P GSCI Precious Metals—SPGSPM), as both gold and silver achieved robust price gains during Q4 2023.  The industrial metals segment realized a modest gain during the quarter (0.82%; S&P GSCI Industrial Metals—SPGSIM), as prices for aluminum, copper, and zinc offset weaker prices for nickel and lead.   

Following a relatively quiet period in Q2/Q3 2023, the digital-assets market performed well during Q4.  The premier digital token, Bitcoin, was up 57% in Q4 2023, while the second most-popular digital token, Ethereum (ETH), was up 37%, bringing the yearly returns to 155% and 91%, respectively.  Speculation over the approval by the Securities and Exchange Commission (SEC) of a US spot Bitcoin exchange-traded fund (ETF) was a significant driver of price movements during the period; this was subsequently approved in January 2024.


UnderConstruction_shutterstock_415850113 [Converted]
EUROPE

According to data from Eurostat, economic growth across the Eurozone declined (-0.1% quarter over quarter) in the third quarter, as the region faced headwinds from inflation, rising interest rates, and tightened fiscal policies.  Among the larger economies, France, Spain, and Belgium experienced growth while Germany contracted from persistent inflation, high energy prices, and weak foreign demand.  Forward-looking economic indicators weakened for the region; the HCOB's final Composite PMI came in at 47.0.  Manufacturing activity continued to contract and demand for services declined as consumers pulled back on spending.  However, there was some signs of improvement in the manufacturing sub-indices tied to new orders and purchasing activity.  Additionally, Eurozone unemployment remained at a record low of 6.4%; employment increased in both services and construction, offsetting weakness in the manufacturing sector. Overall, job vacancy rates have come down from their peaks but remain relatively high by historical standards.

After declining for much of the past year, the rate of inflation across the Eurozone rose to 2.9% in December. The uptick in inflation was primarily due to technical factors, as the impact of base effects and the timing of government subsidies overwhelmed slower price growth for other goods. (Note, core inflation, which doesn’t include energy, food, alcohol, and tobacco prices, ended the year at 3.4%, down from its 2022 peak.) In its last meeting of the year, the European Central Bank (ECB) reaffirmed its benchmark interest-rate policy and announced plans to phase out the last of its COVID-19 era bond-buying programs. The ECB also changed its language around inflation—from describing it as “expected to remain too high for too long,” to saying that it will “decline gradually over the course of next year.”  In her statements following the meeting, ECB President Christine Lagarde assumed a more measured tone and argued against calls for imminent cuts to interest rates, stating that it’s too early to “lower our guard” and that the bank is “data dependent, not time dependent.”

UnderConstruction_shutterstock_415850113 [Converted]
CHINA

China’s economic data in Q4 2023 presented a mixed picture.  Industrial output experienced a significant rebound, growing by 4.6% (year on year) in October and an impressive 6.6% in November.  This growth—the fastest pace since February 2022—underscored the sector’s recovery and contribution to the economy.  On the other hand, already affected by a downturn in the property sector, reduced land sale revenue, and a slowdown in export manufacturing, consumer spending was further impacted by household deleveraging.  Credit cards and mortgage loans saw a decline, indicating caution among consumers.  Overall spending remained below pre-COVID levels, suggesting a slow and gradual path towards recovery.

In response to the property market's challenges, the Chinese government rolled out several initiatives, including reducing down-payment thresholds and mortgage interest rates, and easing restrictions on second-home purchases.  Such measures were designed to ease financial pressure on homebuyers and stimulate market activity.  Another notable development was the provision of low-cost financing, amounting to CN¥1 trillion, for urban village renovations and affordable housing projects.  This significant investment is intended to support the real-estate sector, a critical component of China's economy.  Early indications suggest a positive reception from homebuyers, particularly in major cities, signaling a potential upturn in the real-estate market.

The November 2023 meeting between Chinese President Xi Jinping and US President Joe Biden was a landmark event.  Key topics included curbing illicit fentanyl production and military cooperation, alongside a dialogue on artificial intelligence emphasizing the importance of managing risks and safety issues.  Described as ‘constructive and productive,’ the meeting underlined both leaders' desire for peaceful coexistence and the necessity of avoiding miscommunication.  While it did not resolve all critical geopolitical issues, the meeting was viewed as a positive step towards stabilizing US-China relations.  The meeting's conciliatory tone and focus on cooperation in specific areas signaled a potential easing of the strained relations between the two nations.

UnderConstruction_shutterstock_415850113 [Converted]
JAPAN

Japan’s economy contracted at an annualized growth rate of 2.9% in the third quarter, as a decline in private consumption, which makes up more than half the economy, weighed on economic growth. Although nominal salaries rose year over year, higher prices and inflation wiped out the wage growth in real terms, negatively impacting consumers' purchasing power. In November, Prime Minister Fumio Kishida’s administration announced a new economic stimulus package (approximately $113 billion), aimed at helping households with rising costs. The packages included cuts to income and residential taxes, direct benefits to low earners, extended fuel and electricity subsidies, and funds to support the semiconductor sector.

Japanese business sentiment continued to improve during the quarter as measured by the Tankan survey.  Results were especially strong among large manufactures; automakers' moods brightened as the industry benefited from a weak yen and an easing of supply constraints.  Non-manufacturing sentiment was positive as well, improving for the seventh straight quarter; recovering inbound tourism gave a significant boost to non-manufacturers.  Year to date through November, foreign visitors to Japan topped 20 million for the first time since 2019.

December data showed consumer core inflation trending downwards.  Energy and fuel prices declined due to a combination of government subsidies and base effects.  However, services inflation persists, driven primarily by demand for accommodations and food.  The Bank of Japan (BOJ) ended the year with its low-interest polices in place.  In his statement following the BOJ’s December meeting, Governor Kazuo Ueda cooled speculation about future rate hikes, stressing that more data is needed to confirm a positive wage-inflation cycle and the uncertainty surrounding inflation’s sustainability.

UnderConstruction_shutterstock_415850113 [Converted]
COMMODITIES

The S&P Goldman Sachs Commodity Index (SPGSCI) ended the quarter down with a total return of 10.73%, driven mainly by price gains for industrial metals and precious metals failing to offset weaker prices for energy, agriculture, and livestock.  Contrary to Q3 2023, energy (16.74%; S&P GSCI Energy—SPGSEN) underperformed all other SPGSCI sub-index constituents, with sharply lower prices for crude oil, natural gas, and gas oil.  These detractors to performance occurred despite output cuts from OPEC+. Agriculture (0.73%; S&P GSCI Agriculture—SPGSAG) ended the quarter with higher prices for soybeans, coffee, wheat, and cocoa failing to offset considerable price declines for sugar, corn, cotton, and Kansas wheat.  The precious metals segment outperformed all other commodity constituents during the quarter (10.99%; S&P GSCI Precious Metals—SPGSPM), as both gold and silver achieved robust price gains during Q4 2023.  The industrial metals segment realized a modest gain during the quarter (0.82%; S&P GSCI Industrial Metals—SPGSIM), as prices for aluminum, copper, and zinc offset weaker prices for nickel and lead.   

Following a relatively quiet period in Q2/Q3 2023, the digital-assets market performed well during Q4.  The premier digital token, Bitcoin, was up 57% in Q4 2023, while the second most-popular digital token, Ethereum (ETH), was up 37%, bringing the yearly returns to 155% and 91%, respectively.  Speculation over the approval by the Securities and Exchange Commission (SEC) of a US spot Bitcoin exchange-traded fund (ETF) was a significant driver of price movements during the period; this was subsequently approved in January 2024.

 
ECONOMIC INDICATORS


GMS_2026Q2_CPI
ROLLING 12-MONTH CONSUMER PRICE INDEX
25 YEARS THROUGH JUNE 2026

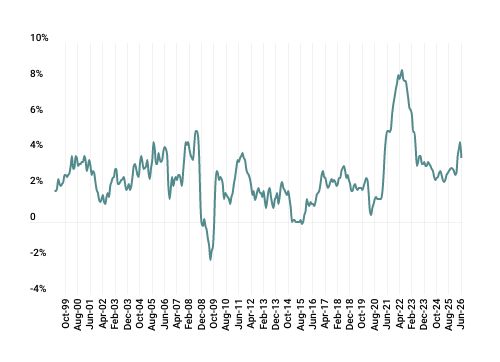
The Consumer Price Index for All Urban Consumers (CPI-U) fell 0.4% in June on a seasonally adjusted basis, the largest single-month decline since April 2020, pulling the twelve-month all-items rate down to 3.5% from 4.2% in May. The move was driven almost entirely by energy, which fell 5.7% for the month as gasoline prices dropped 9.7%, largely reversing the Iran conflict-driven surge recorded in March. Core inflation, which excludes food and energy, was unchanged for the month but decelerated to 2.6% YoY, down from 2.9% in May. Shelter rose 0.1% for the month and 3.3% over the past year. The June print came in below consensus expectations and was broadly welcomed by markets as evidence that the March energy shock was transitory rather than a catalyst for broader price pressures.

GMS_2026Q2_GDP
REAL GROSS DOMESTIC PRODUCT
25 YEARS THROUGH Q1 2026

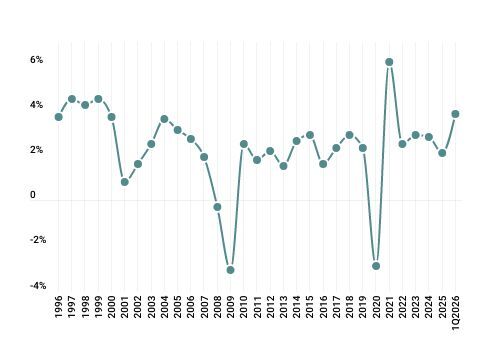
During the first quarter of 2026, real GDP increased at an annualized rate of 2.1% according to the Bureau of Economic Analysis' third estimate released June 25th, a meaningful acceleration from the 0.5% pace recorded in the fourth quarter of 2025. The upward revision from the second estimate of 1.6% was driven primarily by a large downward revision to import growth, from 21.1% to 11.8%, which reduced the net export drag on GDP from 1.3 percentage points to 0.4 percentage points. The contributors to growth were investment, exports, government spending, and consumer spending. From an industry perspective, government value added grew 7.5%, private goods-producing industries expanded 4.5%, and private services-producing industries increased 0.8%.

CoverImage_GMS_RetailSection
RETAIL SALES

Retail and food services sales rose 0.2% in June to $768.6 billion, extending a run of consecutive monthly gains, though the pace slowed meaningfully from May's upwardly revised 1.0% increase. Motor vehicle sales were a notable source of strength, growing 1.9% for the month. Non-store retailers, which include e-commerce, also grew 1.9%, tying motor vehicles for the largest month-over-month advance among major categories. Gasoline station receipts fell 5.3%, reflecting the sharp decline in pump prices as energy markets reversed the Iran-driven spike from earlier in the year; stripping out gas stations, sales rose a more robust 0.7%. Core retail sales declined 0.2% for the month, the first such decline in over a year, warranting continued monitoring as a signal of underlying consumer demand.

GMS_2026Q2_UnemploymentRate
Unemployment RATE
25 YEARS THROUGH JUNE 2026

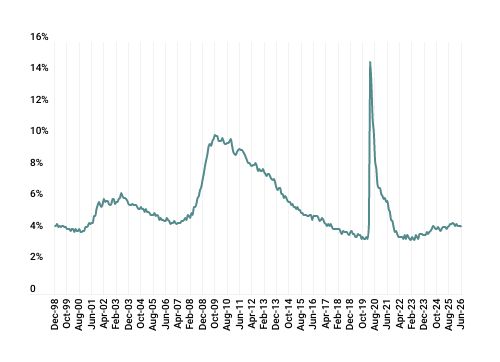
The labor market continued to soften in the second quarter. The economy added 57,000 jobs in June, with gains concentrated in professional and business services (+36,000), social assistance (+25,000), and healthcare (+22,000), though healthcare's contribution ran well below its average monthly gain of 38,000 over the prior twelve months. Downward revisions to April and May reduced those two months' combined job creation by 74,000, reinforcing a picture of decelerating hiring. The unemployment rate edged down to 4.2% from 4.3%, while the labor-force participation rate fell 0.3 percentage points to 61.5%. Average hourly earnings rose 0.3% for the month and 3.5% YoY. The broader trend remains concerning: the economy has averaged approximately 15,000 jobs per month over the past six months, compared to 78,000 over the same period one year earlier, and has experienced outright job losses in five of the past twelve months.

GMS_2026Q2_VIX
CBOE VIX DAILY CLOSING VALUES
LAST 10 YEARS

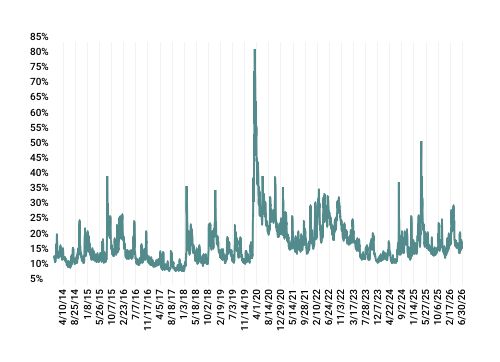
Market volatility declined considerably over the course of the second quarter, with the VIX averaging 18.31, a meaningful improvement from Q1's average of approximately 21-22 and well below the March 27th peak of 31.05. The index opened April elevated at 24.54, reflecting residual geopolitical and tariff-related anxiety, before declining steadily through May to a quarter low of 15.32 on May 29th. A brief spike to 22.22 on June 10th interrupted the trend but proved short-lived; the index closed the quarter at 16.45. For long-term institutional investors, the quarter's trajectory (elevated entry, orderly decline, contained close) suggests that the acute uncertainty of Q1 has abated, though the index remains modestly above its long-term average and inflation and labor market risks have not fully resolved.

 
DOMESTIC EQUITIES


CPI
CPI

The Consumer Price Index for All Urban Consumers (CPI-U) increased 0.3% in December, following a 0.1% increase in November.  The all-items index rose 3.4% before seasonal adjustment over the previous twelve months.  Over the past twelve months, the major contributors include transportation services, up 9.7% (driven by motor-vehicle insurance, up 20.3%), tobacco and smoking products, up 7.8%, and shelter, up 6.2%.

GDP
GDP

During Q3 2023, real GDP rose at an annual rate of 4.9% followed by a 2.1% increase in Q2 2023.  The increase was driven by consumer spending and inventory investment; imports also increased. Overall, 14 of 22 industry groups contributed to real GDP growth in the third quarter; the value added from private goods-producing industries was particularly strong at 10.2%.

Retail Sales
Retail Sales

Total retail and food sales increased 0.3% and 4.1% month-to-date and year-to-date ending November 2023, respectively.  Total sales from September through November 2023 were up 3.4% compared to the same period one year ago; the percentage change over the same period was up 0.4%.  Significant contributors include non-store retailers and food services and drinking places. 

Unemployment
Unemployment
A total of 494,000 jobs were created in the fourth quarter of 2023, which did not outpace the previous quarter’s gains of 710,000.  The US economy added 216,000 jobs in November, which is below the twelve-month average monthly gain of 225,000. December’s notable job gains occurred within the following industries: government (+52,000), health care (+38,000), social assistance (+21,000), and construction (+17,000).
 
The unemployment rate remains unchanged from the previous quarter’s average at 3.7%.  The number of unemployed persons (6.3 million) experienced minimal net movement as well.  The labor force participation rate decreased by 0.3% in December (62.5%).
VIX
VIX

Market volatility, as measured by the VIX Index, had an average close in Q4 2023 at 15.29, trending up from Q3 (15.01) and down from Q2 (16.48).  The index has dropped below its five-year average of 20.58, reflecting positive investor sentiment and a high level of comfort with the overall direction of the economy.

GMS Table Templates
  Q4 2023 YTD   Q4 2023
YTD
Title
0%
0%
Title
0%
0%
Title
0%
0%
Title
0%
0%
Title
0%
0%
Title
0%
0%


  Q4 2023 YTD   Q4 2023
YTD
Large Cap Value
0%
0%
Large Cap Growth
0%
0%
Mid Cap Value
0%
0%
Mid Cap Growth
0%
0%
Small Cap Value
0%
0%
Small Cap Growth
0%
0%


  U.S. Large Cap U.S. Mid Cap U.S. Small Cap
  Q4 2023 YTD Q4 2023 YTD  Q4 2023 
YTD
Title
0%
0%
0%
0%
0%
0%
Title
0%
0%
0%
0%
0%
0%
Title
0%
0%
0%
0%
0%
0%
Title
0%
0%
0%
0%
0%
0%
Title
0%
0%
0%
0%
0%
0%
Title
0%
0%
0%
0%
0%
0%
Title
0%
0%
0%
0%
0%
0%
Title
0%
0%
0%
0%
0%
0%
Title
0%
0%
0%
0%
0%
0%
Title
0%
0%
0%
0%
0%
0%
Title
0%
0%
0%
0%
0%
0%
Title
0%
0%
0%
0%
0%
0%
Title
0%
0%
0%
0%
0%
0%


  Header Header
Header Q4 2023 YTD Q4 2023 YTD 
Title1
0%
0%
0%
0%
Title2
0%
0%
0%
0%
Title3
0%
0%
0%
0%
Title4
0%
0%
0%
0%
Title5
0%
0%
0%
0%


  Header Header
Header Q4 2023 Q4 2023
Title1
0%
0%
Title2
0%
0%
Title3
0%
0%
Title4
0%
0%
Title5
0%
0%


Country Best Performing Style
Title1
Value
Title2
Value
Title3
Value
Title4
Value
Title5
Value
Title6
Value
Title7
Value
Title8
Value
Title9
Value
Title10
Value
Title11
Value
Title12
Value
Title13
Value
Returns by style
  Q4 2023 YTD   Q4 2023
YTD
Large Cap Value
0%
0%
Large Cap Value
0%
0%
Mid Cap Value
0%
0%
Mid Cap Value
0%
0%
Small Cap Value
0%
0%
Small Cap Value
0%
0%


  Q4 2023 YTD   Q4 2023
YTD
Large Cap Value
0%
0%
Large Cap Growth
0%
0%
Mid Cap Value
0%
0%
Mid Cap Growth
0%
0%
Small Cap Value
0%
0%
Small Cap Growth
0%
0%


SECTOR Returns BY CAPITALIZATION
  U.S. Large Cap U.S. Mid Cap U.S. Small Cap
  Q4 2023 YTD Q4 2023 YTD  Q4 2023 
YTD
Basic Materials
0%
0%
0%
0%
0%
0%
Consumer Goods
0%
0%
0%
0%
0%
0%
Consumer Services
0%
0%
0%
0%
0%
0%
Financials
0%
0%
0%
0%
0%
0%
Health Care
0%
0%
0%
0%
0%
0%
Industrials
0%
0%
0%
0%
0%
0%
Oil & Gas
0%
0%
0%
0%
0%
0%
Real Estate
0%
0%
0%
0%
0%
0%
Technology
0%
0%
0%
0%
0%
0%
Telecommunications
0%
0%
0%
0%
0%
0%
Utilities
0%
0%
0%
0%
0%
0%
Source: Russell Investments & Industry Classification Benchmark
Large Cap: Russell Top 200 Index | Mid Cap: Russell Mid Cap Index | Small Cap: Russell 2000 Index


us valuations
  Quarter Ending 12/31/2023 Quarter Ending 9/30/2023
US Large Cap Equity Value Growth Value Growth 
Price/Earnings Ratio
0%
0%
0%
0%
IBES LT Growth (%)
0%
0%
0%
0%
1 Year Forward P/E Ratio
0%
0%
0%
0%
Negative Earnings (%)
0%
0%
0%
0%


  Quarter Ending 12/31/2023 Quarter Ending 9/30/2023
US Mid Cap Equity Value Growth Value Growth 
Price/Earnings Ratio
0%
0%
0%
0%
IBES LT Growth (%)
0%
0%
0%
0%
1 Year Forward P/E Ratio
0%
0%
0%
0%
Negative Earnings (%)
0%
0%
0%
0%


  Quarter Ending 12/31/2023 Quarter Ending 9/30/2023
US Small Cap Equity Value Growth Value Growth 
Price/Earnings Ratio
0%
0%
0%
0%
IBES LT Growth (%)
0%
0%
0%
0%
1 Year Forward P/E Ratio
0%
0%
0%
0%
Negative Earnings (%)
0%
0%
0%
0%


international valuations
  Quarter Ending 12/31/2023 Quarter Ending 9/30/2023
International Equity Value Growth Value Growth 
Price/Earnings Ratio
0%
0%
0%
0%
IBES LT Growth (%)
0%
0%
0%
0%
1 Year Forward P/E Ratio
0%
0%
0%
0%
Negative Earnings (%)
0%
0%
0%
0%


  Quarter Ending 12/31/2023 Quarter Ending 9/30/2023
Emerging Markets Equity Value Growth Value Growth 
Price/Earnings Ratio
0%
0%
0%
0%
IBES LT Growth (%)
0%
0%
0%
0%
1 Year Forward P/E Ratio
0%
0%
0%
0%
Negative Earnings (%)
0%
0%
0%
0%
Source: Russell Investments Total Equity Profile


non-us developed / emerging cap & style
  Q4 2023 YTD   Q4 2023
YTD
Large Cap Value
0%
0%
Large Cap Value
0%
0%
Mid Cap Value
0%
0%
Mid Cap Value
0%
0%
Small Cap Value
0%
0%
Small Cap Value
0%
0%


  Header Header
Header Q4 2023 Q4 2023
Title1
0%
0%
Title2
0%
0%
Title3
0%
0%
Title4
0%
0%
Title5
0%
0%


Country Best Performing Style
Australia
Value
Brazil
Value
Canada
Value
China
Value
France
Value
Germany
Value
Hong Kong
Value
Indonesia
Value
Italy
Value
Japan
Value
Mexico
Value
Singapore
Value
Spain
Value
Thailand
Value


GLOBAL EQUITIES
GLOBAL EQUITY PERFORMANCE

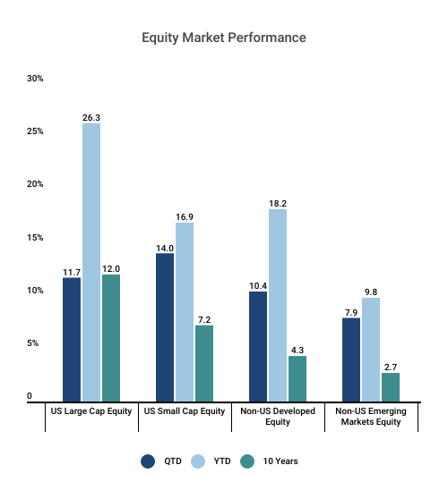
Global equity markets staged a powerful recovery in the second quarter of 2026, delivering their strongest broad gains since 2020. The S&P 500 rose 15.2%, the MSCI EAFE index gained 10.8%, and the MSCI Emerging Markets Index surged 24.1%. The primary catalyst for the quarter's strong performance was the easing of Middle East tensions, as a US-Iran ceasefire agreement led to a meaningful decline in oil prices from their prior highs and reduced inflation fears. Investor risk appetite recovered broadly, as corporate earnings continued to surprise to the upside, and enthusiasm for artificial intelligence infrastructure investment, particularly in semiconductors and related hardware, intensified.

Within developed markets, performance diverged sharply along the lines of technology exposure and sensitivity to the prior quarter's energy shock. The Netherlands was the standout performer, gaining 36.0% on the quarter, driven by the continued strength of its technology and industrial sectors, notably ASML and Siemens AG. Austria (+22.4%), Belgium (+17.3%), Denmark (+14.9%), Italy (+14.5%), Ireland (+13.1%), and Japan (+14.2%) also delivered strong results, as the reversal of the energy price spike that had weighed on these markets in Q1 combined with improving macro sentiment to drive a broad re-rating. Spain advanced 15.1%, extending a multi-quarter run as credit upgrades and narrowing fiscal deficits continued to draw institutional capital. Conversely, Norway fell 14.1% as energy prices retreated sharply following the ceasefire agreement.

Within emerging markets, South Korea surged 87.6% on the quarter as Samsung Electronics and SK Hynix, which together represent more than 40% of the benchmark's weighting, delivered extraordinary returns driven by insatiable demand for high-bandwidth memory chips essential to AI data-center infrastructure globally. Taiwan gained 48.9%, similarly propelled by TSMC, which accounts for over 40% of the TAIEX Index's market capitalization. Both markets have, in effect, become high-conviction proxies for the AI infrastructure buildout, attracting significant capital flows from investors seeking direct exposure to the semiconductor cycle. On the downside, Indonesia declined 26.2% as the combination of a stronger US dollar and persistent concerns about its fiscal position weighed on the market. China also notably declined despite its sizable technology sector, as domestic growth, the pace of its transition toward advanced manufacturing, and policy concerns muted investor enthusiasm.


row-spacer
row-spacer
US VALUATIONS


INTERNATIONAL VALUATIONS


HEDGE FUNDS
HEDGE FUND PERFORMANCE
 
PRIVATE EQUITY
PRIVATE EQUITY PERFORMANCE


FIXED INCOME
US SPREAD PRODUCTS

Investment-Grade Corporate Bonds: The market returned 1.4% for the quarter. Spread tightening and interest income contributed to the return. Spreads tightened by 15 bps (to 74 bps) and remain near their lowest level since 1998; the market digested elevated issuance and remained focused on robust corporate revenue and earnings growth. Lower-quality issues outperformed: Baa-rated, 1.7%; A-rated, 1.3%; and Aa-rated corporates, 40 bps. Issuance was a heady $560 billion; buoyed by SpaceX’s record $25 billion offering, investment-grade issuance increased by 39% from the same quarter a year prior.

High-Yield Corporate Bonds: The market returned 2.5% for the quarter. Spread tightening and interest income contributed to the return. Spreads tightened by 47 bps (to 270 bps), nearly one standard deviation below their historical average. Lower-quality issues outperformed: Caa-rated, 3.0%; B-rated, 2.8%; and BB-rated corporates, 2.3%. The twelve-month trailing default rate for unsecured high-yield bonds is currently 189 bps and rising. Issuance was $105 billion, an increase of 36% from the same quarter a year prior.


Russell2000_shutterstock_2294146949

hello world


test-4-gms
GDP

During Q3 2023, real GDP rose at an annual rate of 4.9% followed by a 2.1% increase in Q2 2023.  The increase was driven by consumer spending and inventory investment; imports also increased. Overall, 14 of 22 industry groups contributed to real GDP growth in the third quarter; the value added from private goods-producing industries was particularly strong at 10.2%.

test-4-gms
Retail Sales

Total retail and food sales increased 0.3% and 4.1% month-to-date and year-to-date ending November 2023, respectively.  Total sales from September through November 2023 were up 3.4% compared to the same period one year ago; the percentage change over the same period was up 0.4%.  Significant contributors include non-store retailers and food services and drinking places. 

test-4-gms
Unemployment

A total of 494,000 jobs were created in the fourth quarter of 2023, which did not outpace the previous quarter’s gains of 710,000.  The US economy added 216,000 jobs in November, which is below the twelve-month average monthly gain of 225,000.  December’s notable job gains occurred within the following industries: government (+52,000), health care (+38,000), social assistance (+21,000), and construction (+17,000).

The unemployment rate remains unchanged from the previous quarter’s average at 3.7%.  The number of unemployed persons (6.3 million) experienced minimal net movement as well.  The labor force participation rate decreased by 0.3% in December (62.5%).

test-4-gms
VIX

During Q2 2023, real GDP rose at an annual rate of 2.1%, following a 2.2% increase in Q1. The increase was driven by state and local government spending, non-residential fixed investment, and consumer spending, partially offset by a decrease in exports; imports also decreased. Relative to Q1, the second quarter experienced a slowdown in consumer and federal government spending alongside the decline in exports, which drove the Q2 deceleration of real GDP.

 
MID CAP VALUE VS. GROWTH
ROLLING 1-YEAR PERFORMANCE VS. RUSSELL 2000
12/31/2013 TO 12/31/2023

LARGE CAP VALUE VS. GROWTH
 
ROLLING 1-YEAR PERFORMANCE VS. RUSSELL 2000
 
12/31/2013 TO 12/31/2023
 
 
Charts
YIELD CURVE

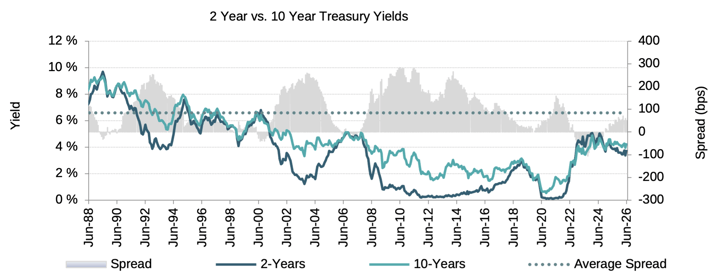
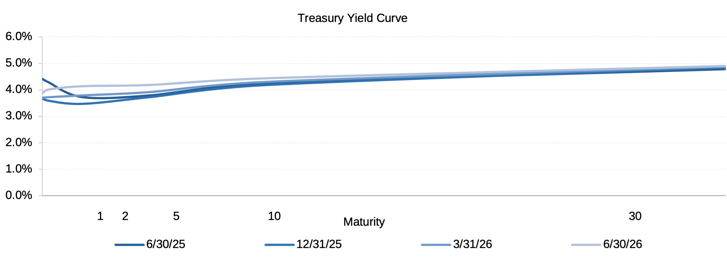
US Treasury yields rose while the curve flattened during the quarter. The two-year yield increased by 35 bps to 4.1%, while the ten-year yield increased by 14 bps to 4.4%. The two- to ten-year spread fell by 21 bps to settle at +30 bps; the spread has remained below the long-term average (+85 bps) since December 2021. Treasury yields climbed steadily higher as Fed rhetoric turned hawkish, while inflation and employment growth increased. From January to May, CPI rose from 2.4% to 4.2% YoY; in the same period, the economy added 552,000 jobs, notably higher than the 162,000 jobs added in the same period in 2025.
 

GMS_Treasury2-10_2026Q2


GMS_YieldCurve_2026Q2


Love these and want more?

Enter your email address below and we will let you know when we add new resources.